Historical Changelogs
September 14, 2023 - Business Glossary & ThoughtSpot
ThoughtSpot Integration

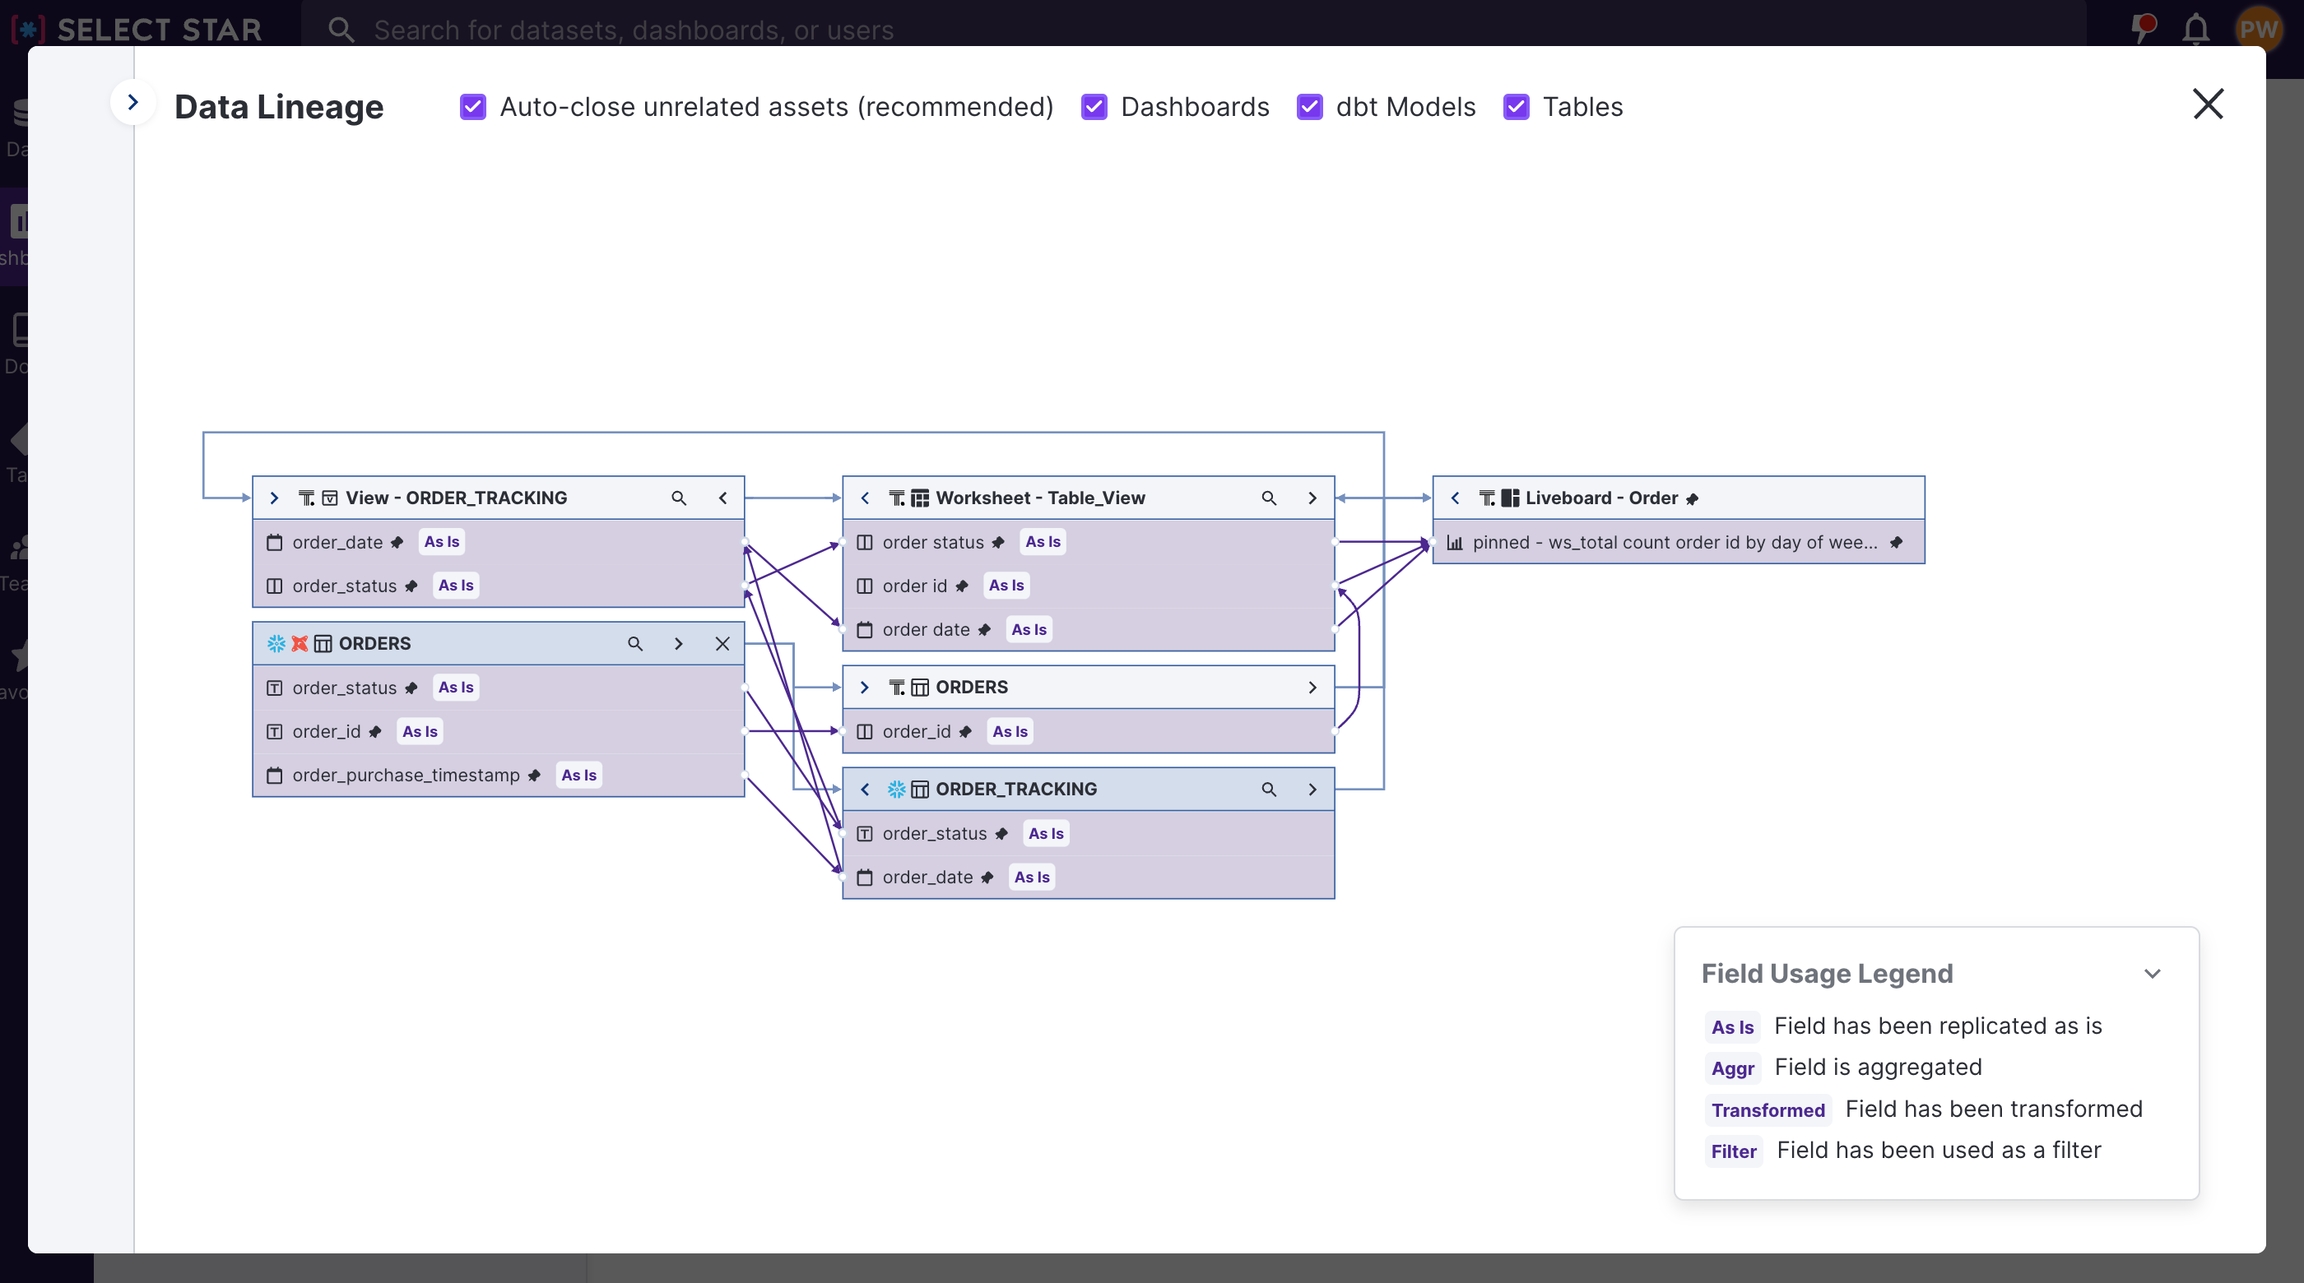
We are delighted to announce our new integration with ThoughtSpot! This integration allows you to view the metadata for all Liveboards, Answers, and all data objects in your ThoughtSpot environment, including tables, views, and worksheets. Additionally, you can explore the comprehensive lineage, both upstream and downstream, for all ThoughtSpot objects and your Data Warehouse tables.
Business Glossary
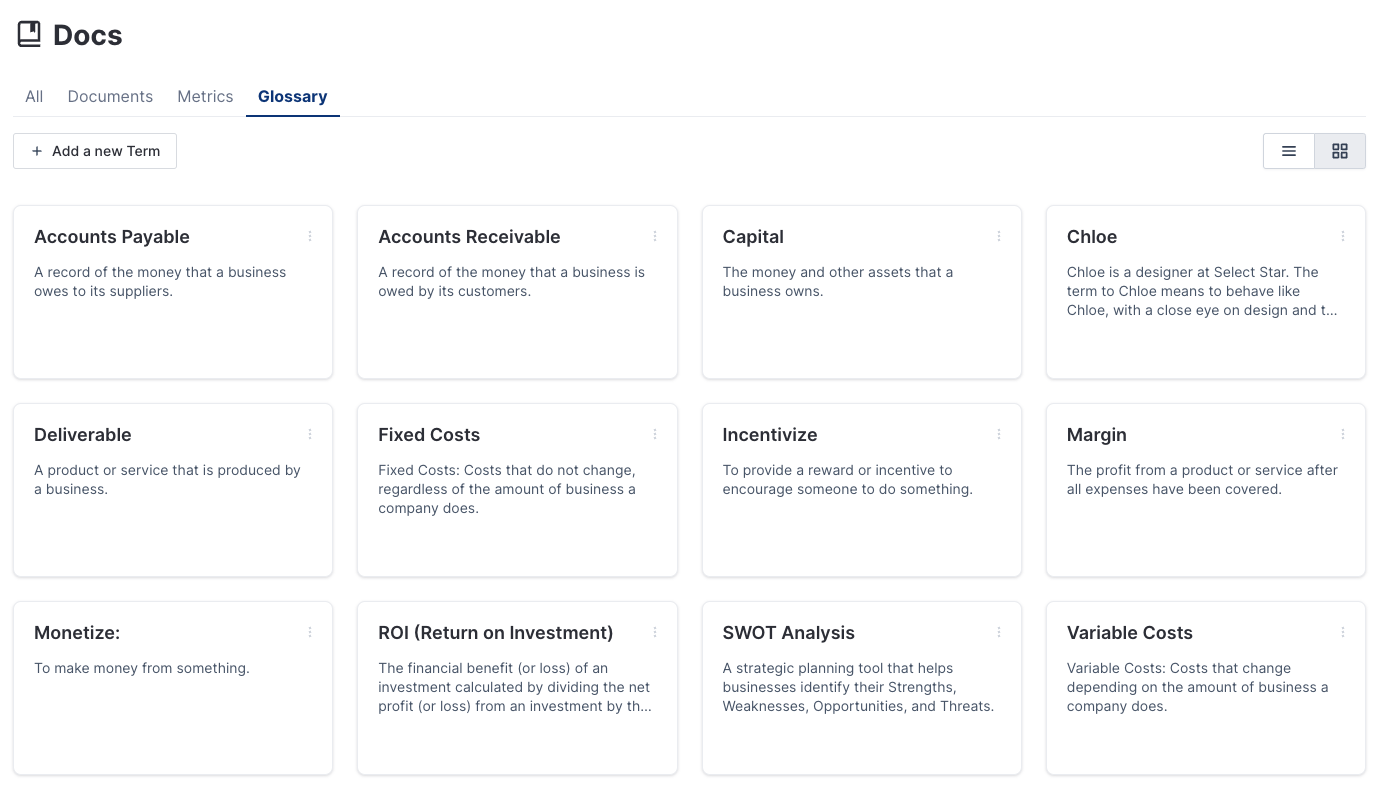
Business Glossaries are present in most organizations, providing a list of business terms and their definitions that are used consistently across departments and teams to
ensure everyone is speaking the same (business) language
. Because Glossaries are important for business, we create a document type just for the terms. This new document type allows users to more easily find and browse the key vocabulary of the business.
August 29, 2023 - Cost Analysis Warehouse Update, Data Type Column and Popilarity Info Tooltip
1. Cost Analysis Warehouse Update
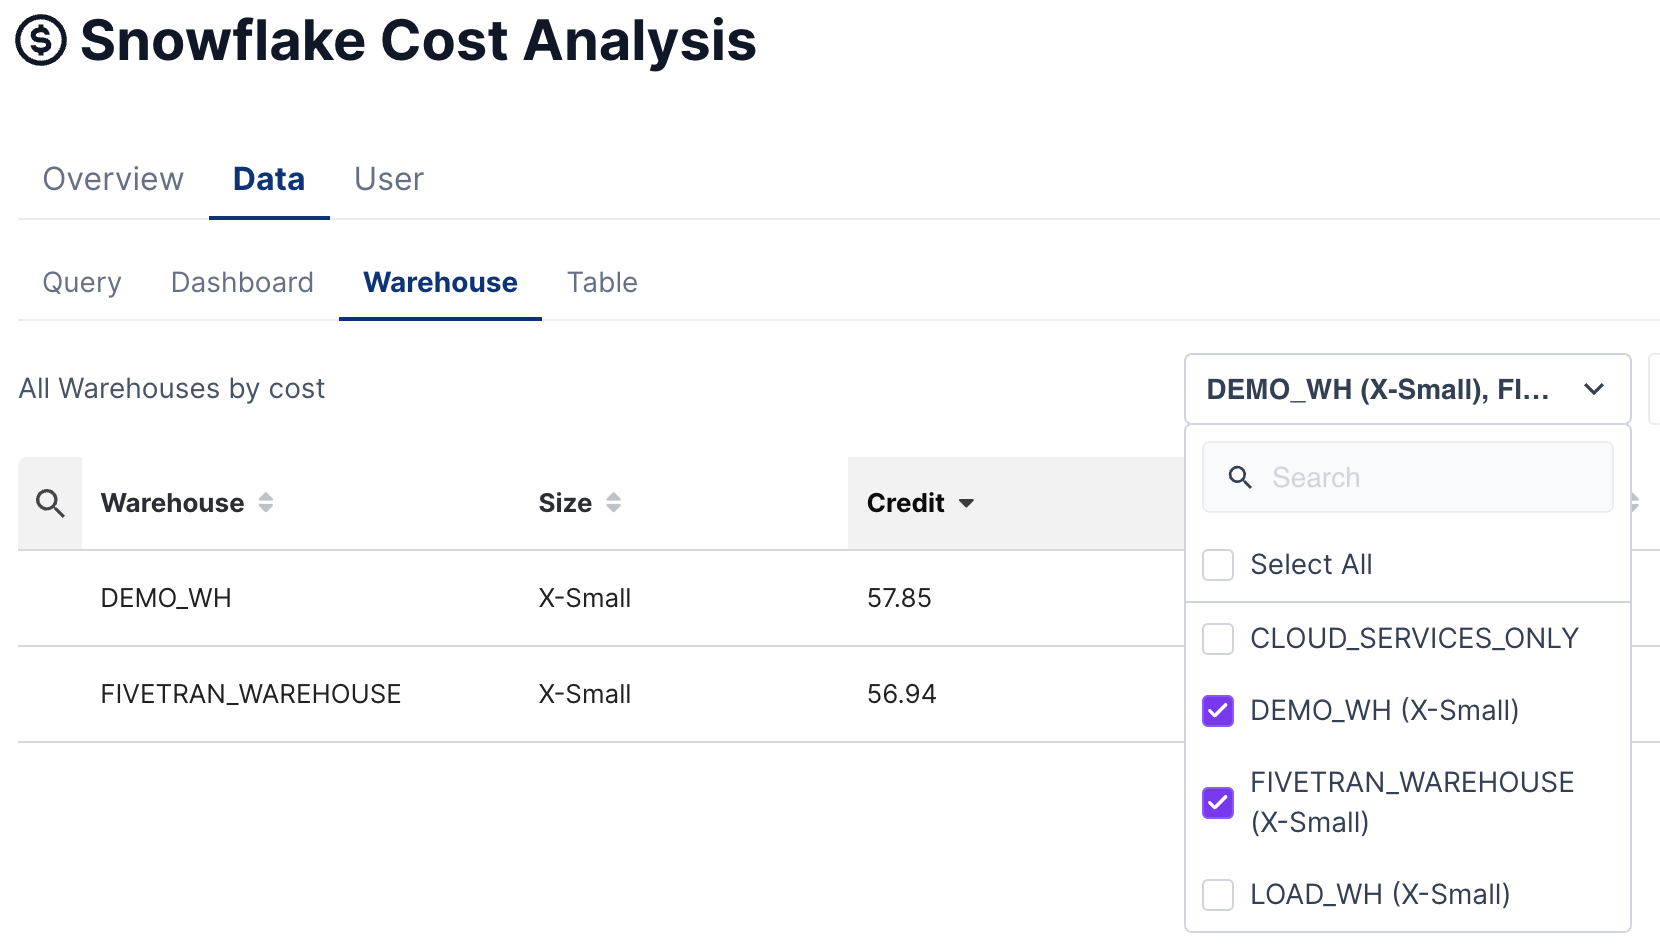
We're thrilled to announce the ability to filter cost insights by Snowflake warehouse and additional warehouse size insights. This enhancement empowers you to easily dive into specific warehouse groups, enabling a clearer understanding of your Snowflake Cost.
2. Data Type Column
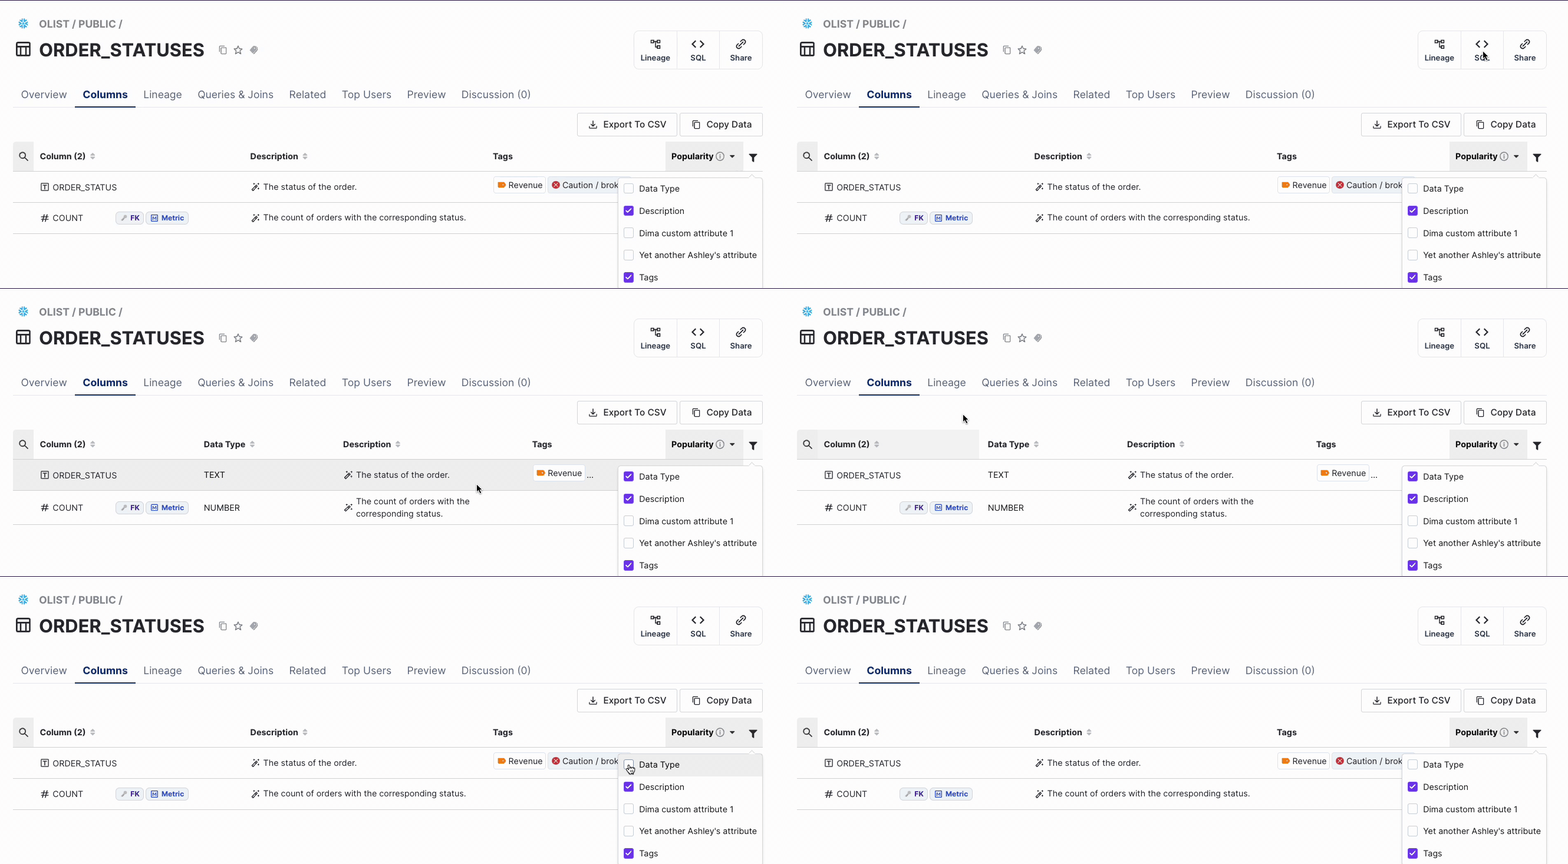
The new Data Type column has been added to data warehouse tables. This data point shows the data type of each column for easy readability.
3. Popularity Info Tooltip
There is a new tooltip in town to help new users in the organization better understand what popularity is and how to use it. We have added an info icon next to popularity in the list view. When a user clicks on the icon, a tooltip pops up to explain how the popularity score is calculated.

August 21, 2023 - Github Config UI, User CSV Download, Cost Analysis - Data Warehouse Filter and Breadcrumbs on Favorites!
1. Github Config UI
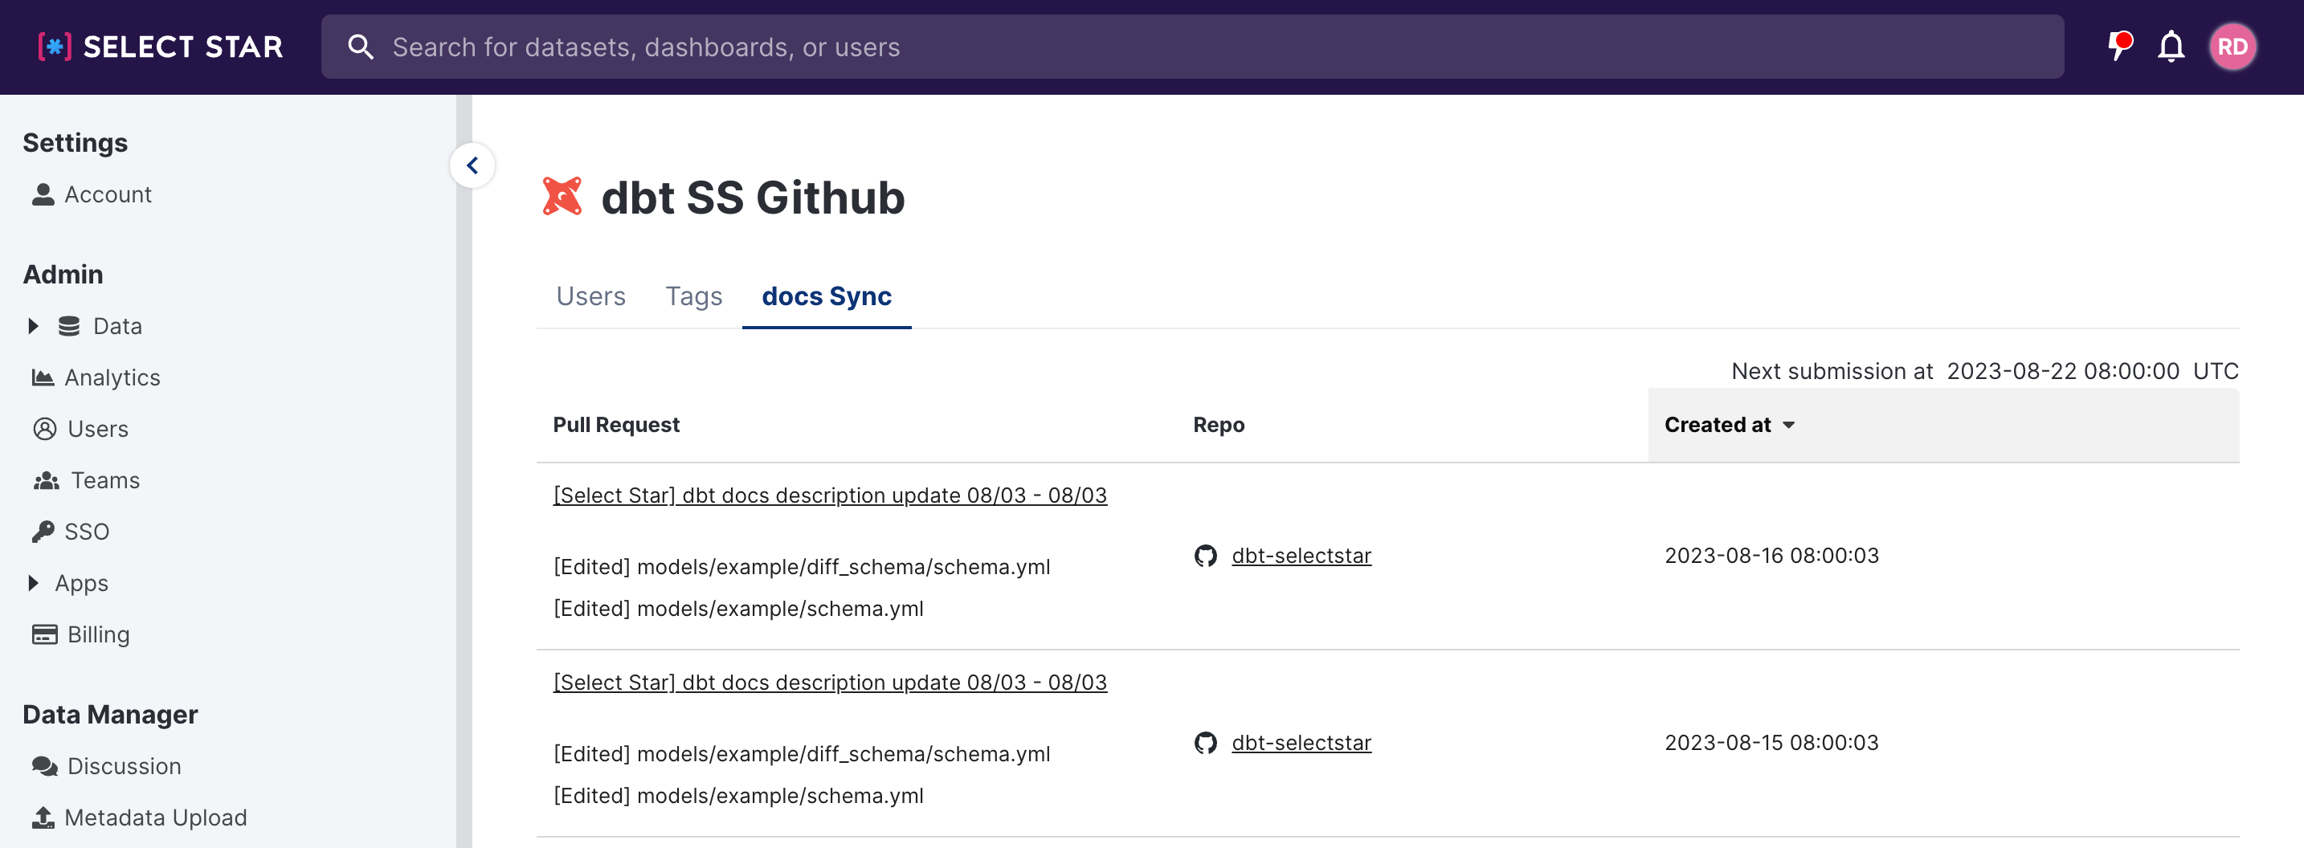
Setting up your GitHub repository and dbt connection is now even more convenient with the option to configure everything directly from the UI.

Furthermore, you'll now have the ability to view a comprehensive list of PRs that were generated via the docs Sync feature within your GitHub repository for your dbt datasource.
2. User CSV Download & User management API Update
Now you can download all your organization users at Select Star including the information such as name, email, role, and SSO.

In addition, we've made another update! You can update each user's team via the API without needing to accessing to Select Star.
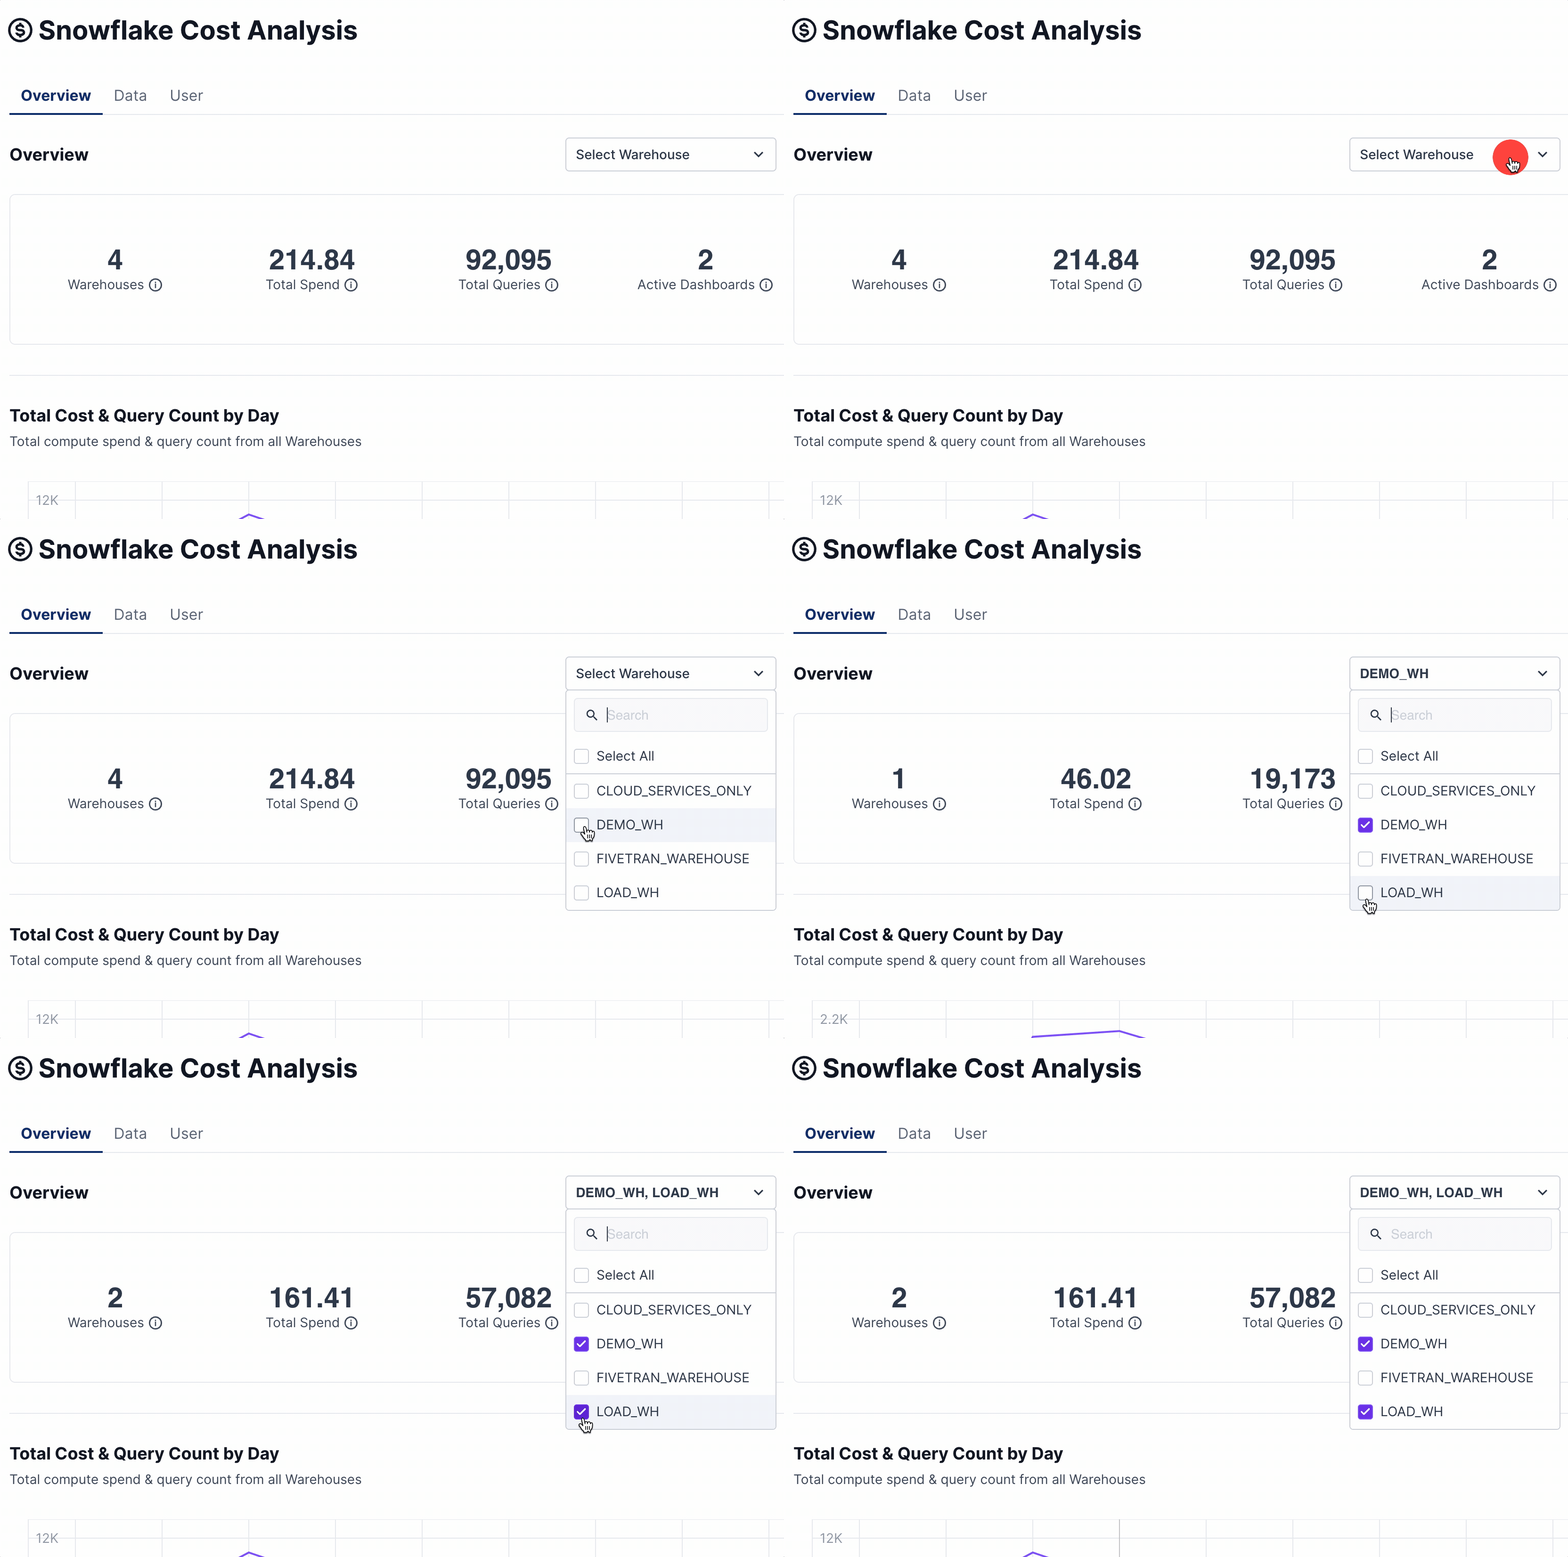
3. Cost Analysis - Data Warehouse filter
You now have the power to select a subset of warehouses from the list and seamlessly run the analysis that fits your needs perfectly.
4. Breadcrumbs on Favorites
Showing the data object file path on Favorites allows users to quickly and easily access the data object's location. Users can easily understand the data object's location, especially when there are tables with the same name in different schemas.

August 3, 2023 - AI Docs for BI Tools, User Management API and Database and Schema Owners
🌟 AI Generated Documentation for BI Tools (Beta)
We recently release AI documentation for data schemas, today we are excited to expand support to BI dashboards, charts and datasets.
With AI generated documentation, you can quickly generate documentation for all your data assets, backed by OpenAI's chatGPT.
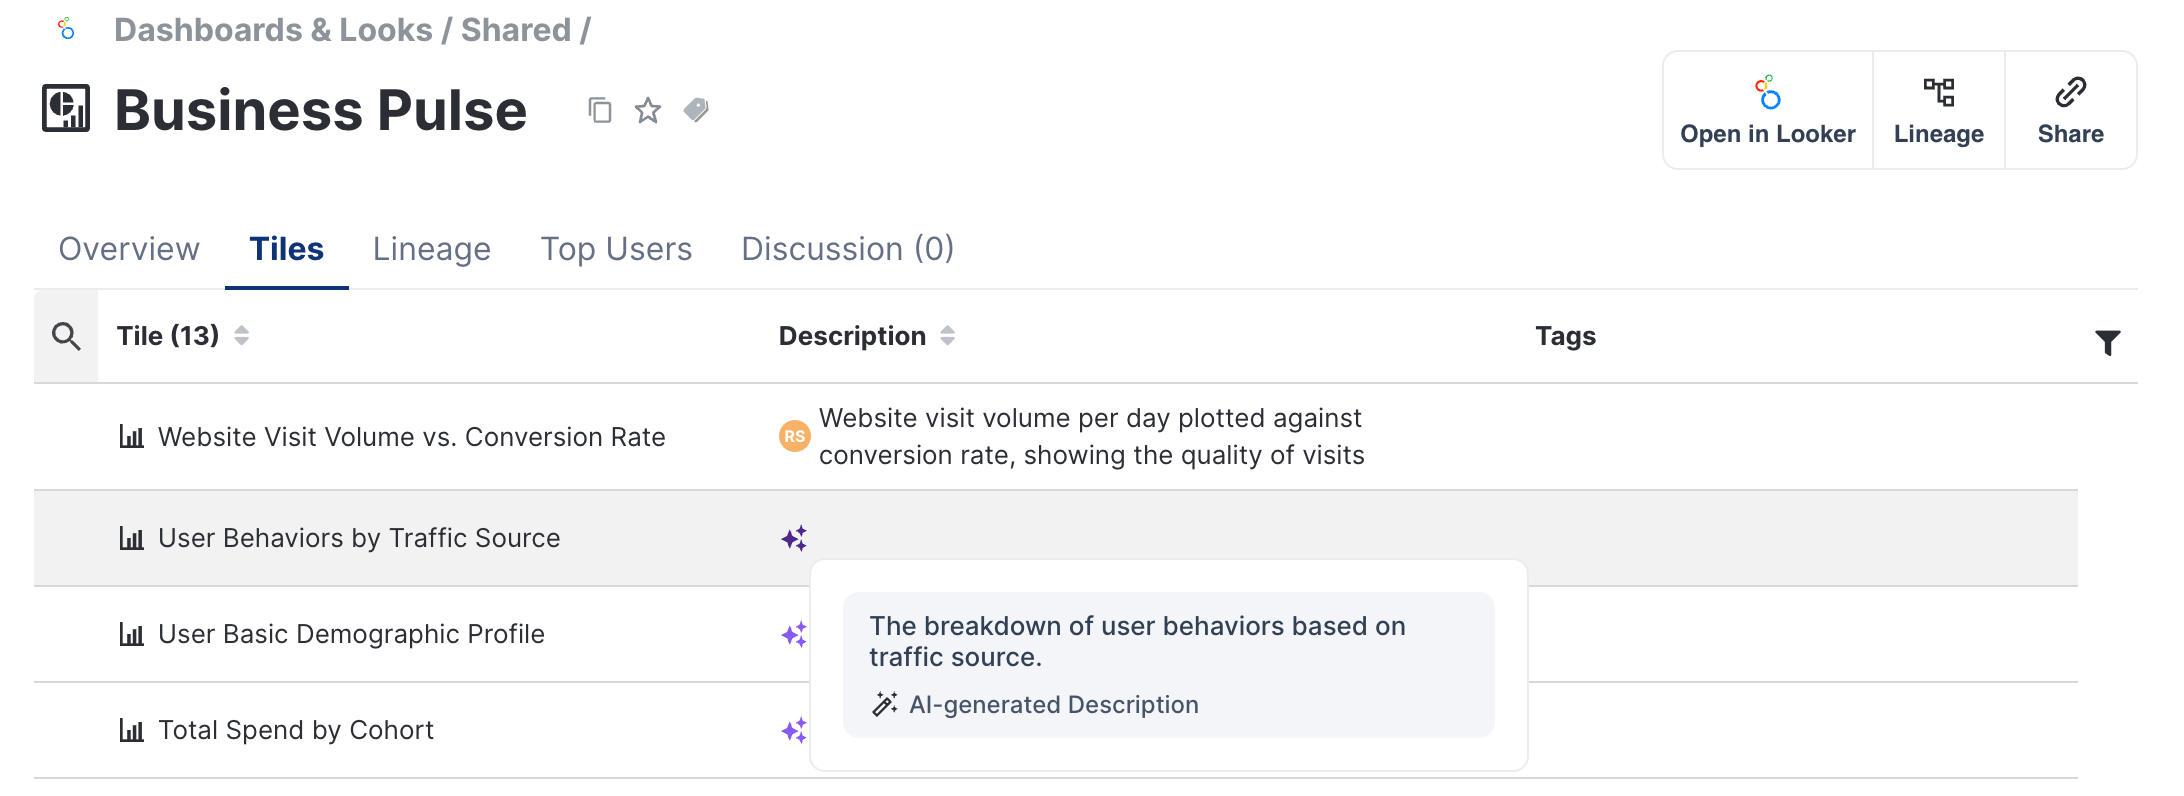
Additionally, the AI description as well as any other available description can be retrieved with the
GET /v1/metadata/<guid>/
endpoint.
Note: Select Star will send dashboard and chart titles, column sql definitions, schemas, queries, and existing documentation to facilitate description generation.
🧑🏻💼 User Management API
Operating at scale is important for organizations with a lot of data and many users. Our latest additions to our API will help you manage and review users as well as their permissions.
User Management
- use our new Users API to create, edit and delete users by API. This can be combined with our new Teams API to additionally add users to a team and modify team membership.
Audit Access
- use the new Users API to retrieve information on existing users, including their role, to ensure that each user has the correct level of access.
Check out our documentation for some handy examples and our API docs for full details.
🌟 Database and Schema Popularity and Owners
We've updated our database and schema page to display its popularity and owners. By understanding who owns the data and how popular it we believe that you can make better decisions about how to use the data in the organization.

This information is also available via API
We're excited for these changes and hope you are too!
July 28, 2023 - Sync descriptions back to dbt with dbt Docs Sync, See owned documents on Team and User pages and more!
We're excited to announce several updates that we believe will enhance your Select Star experience.
🌟 dbt Docs Sync (Private Preview)
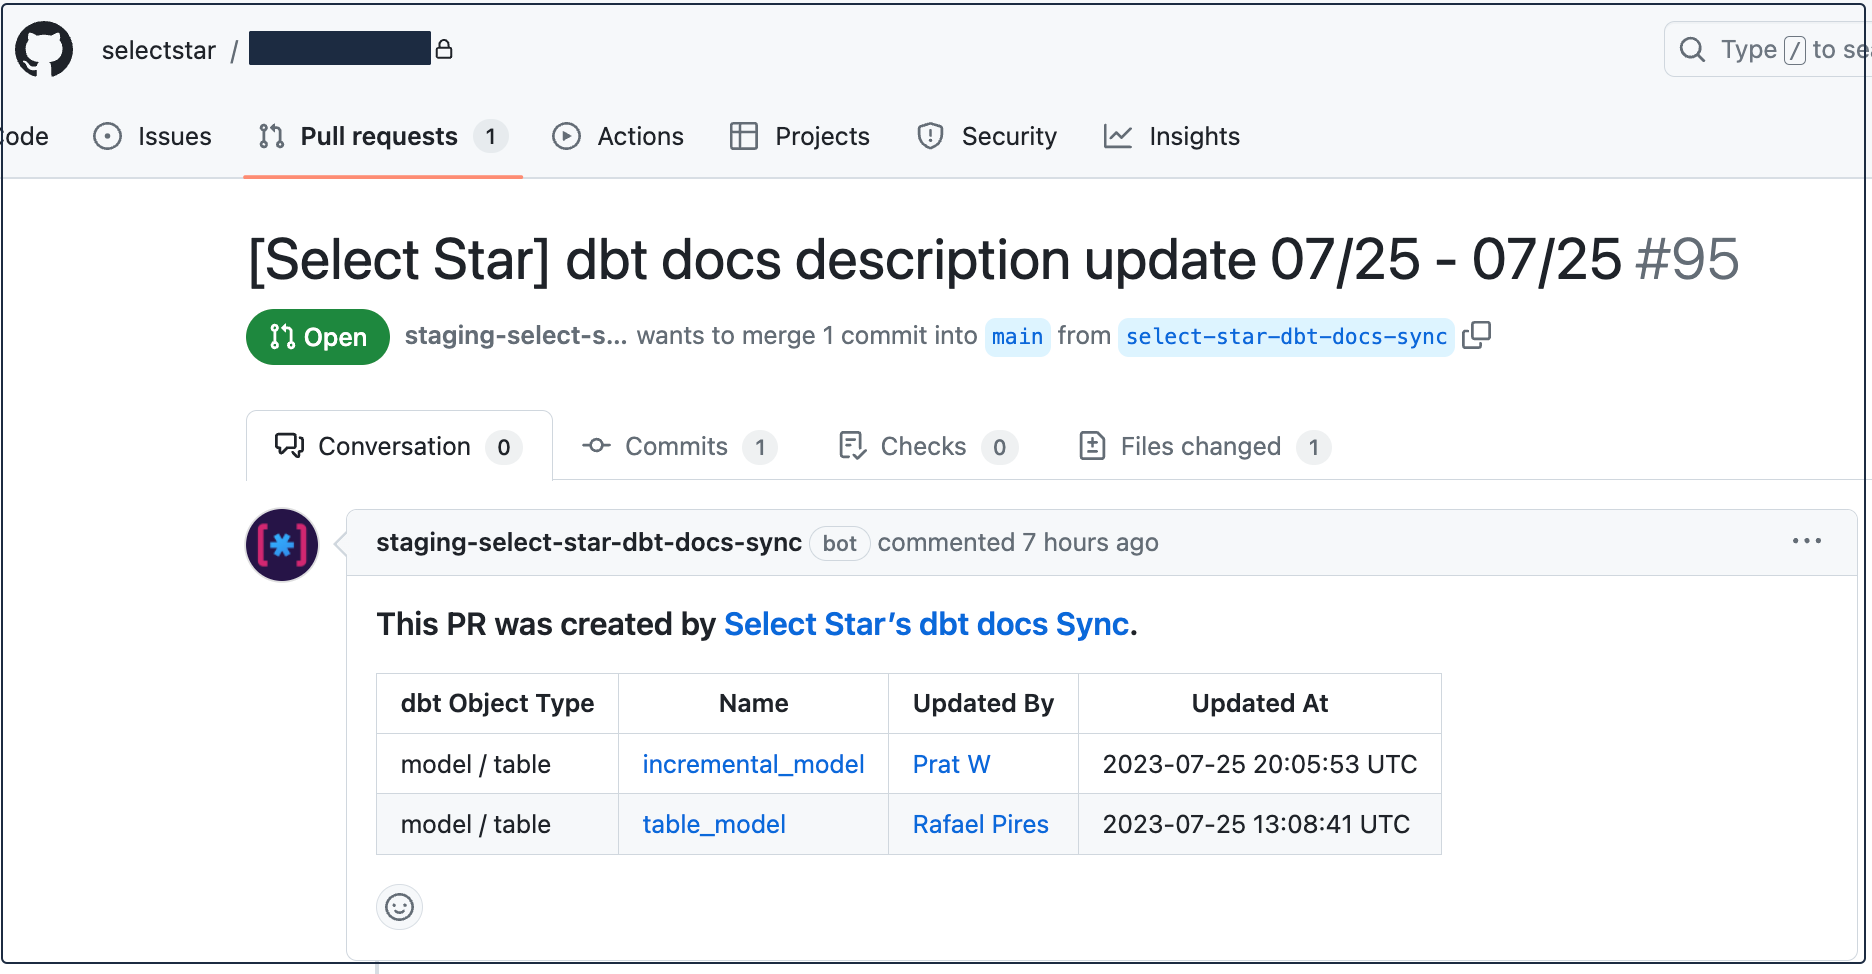
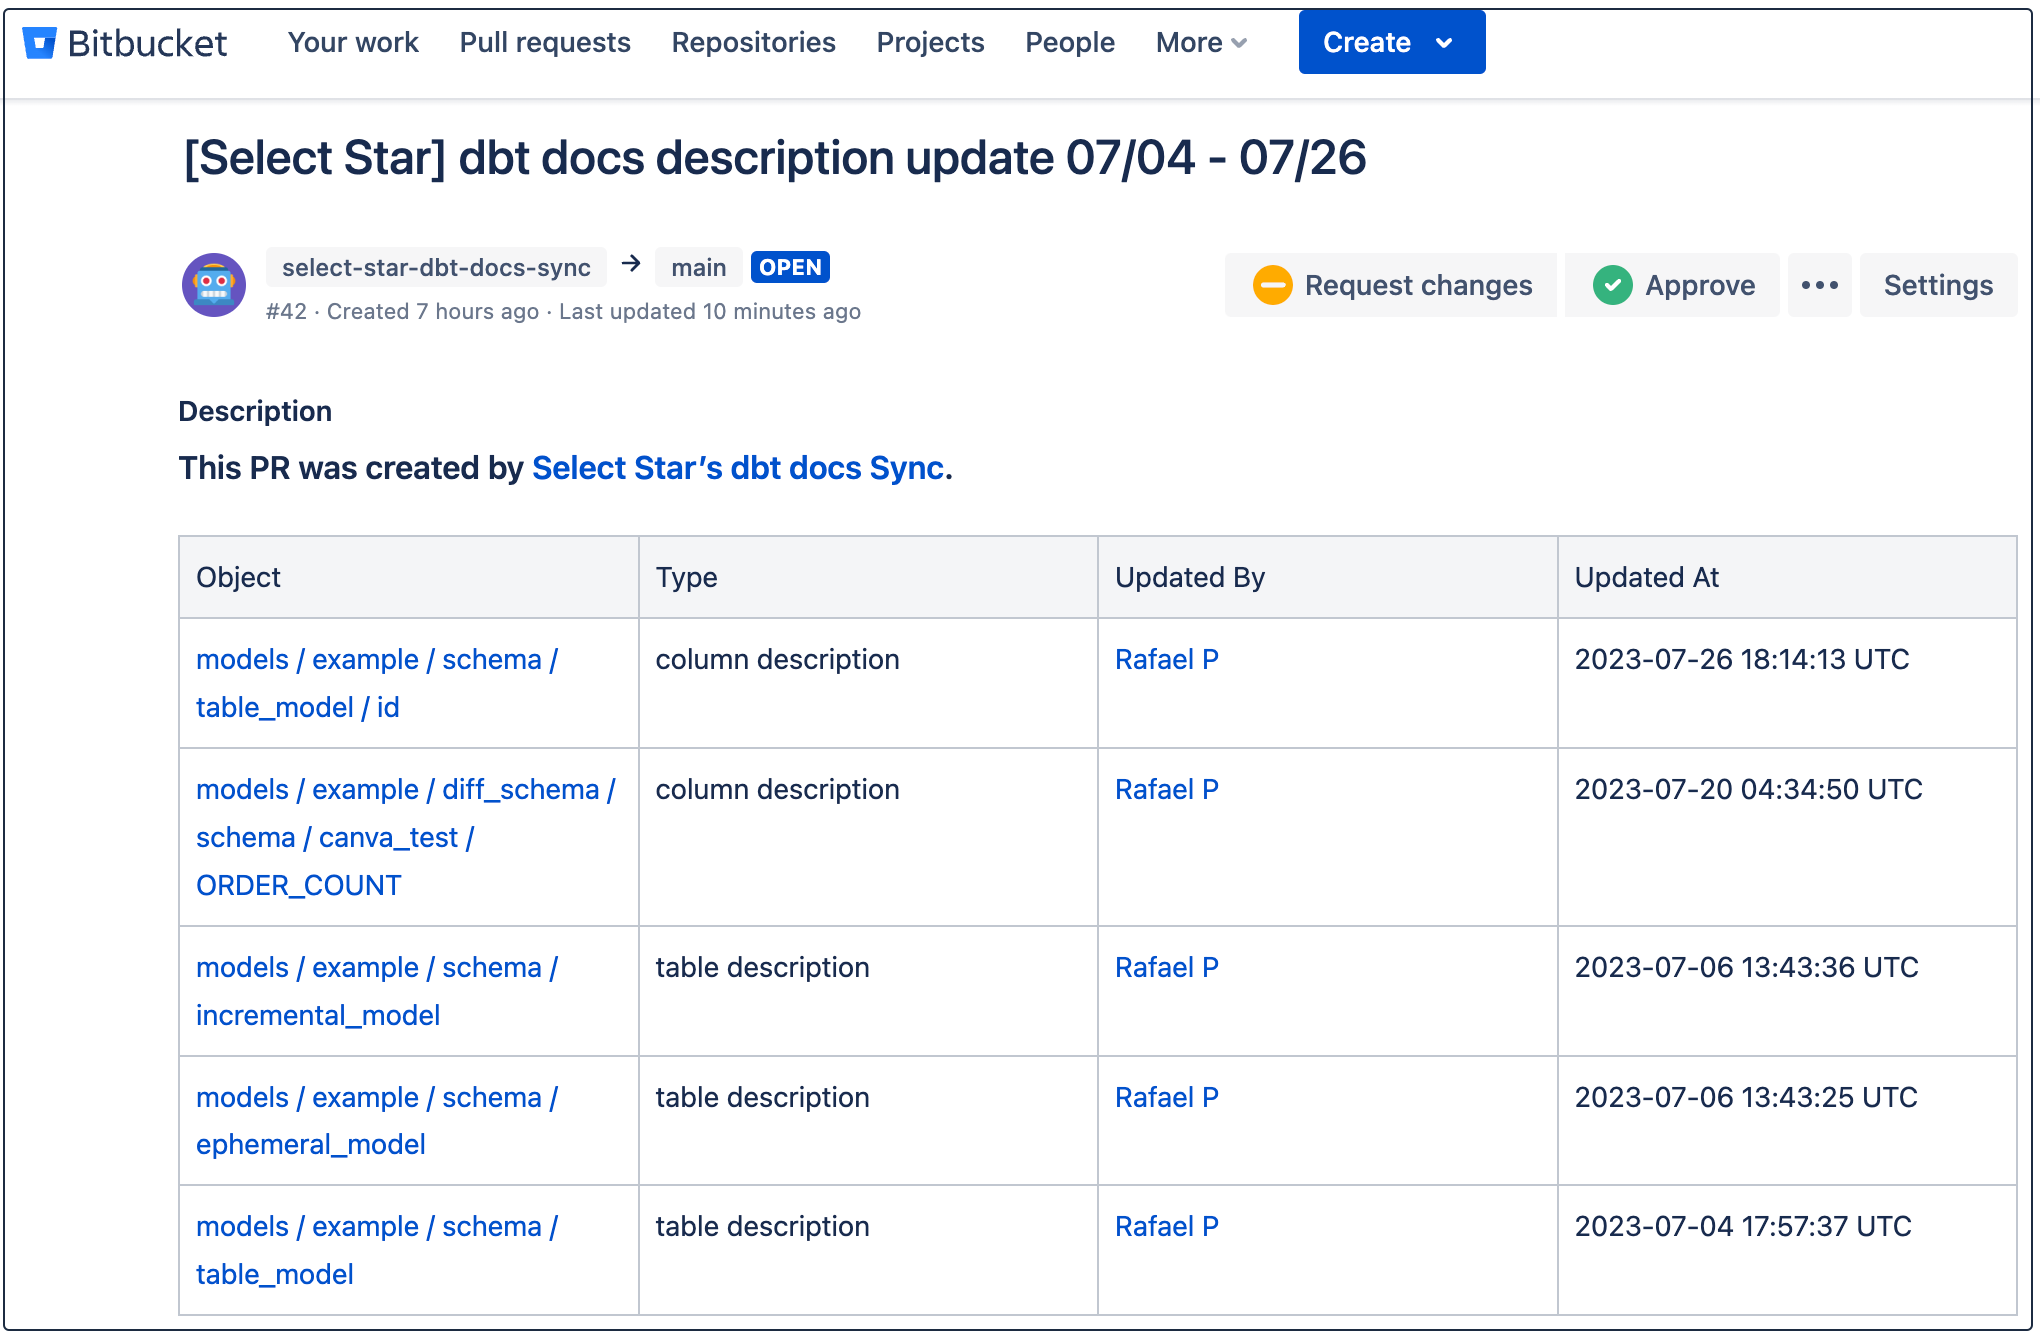
We are thrilled to announce our latest feature - dbt docs Sync! With this addition, you can now sync your table/column descriptions visible in Select Star back to your dbt Github or Bitbucket repo.
[Github PR]
[Bitbucket PR]
📄 Team and User Pages: Showing Owned Documents
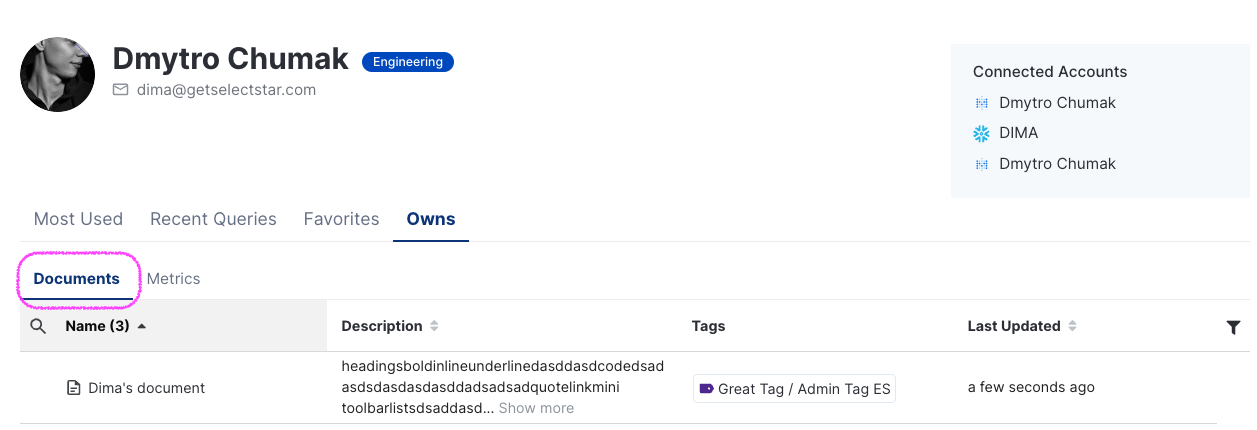
If you know where a document is located, you can easily share it with other teams or individuals. This promotes collaboration and improves the efficiency of your data-driven workflows.
With this enhancement to team and user pages, you can quickly see documents that are owned by the team or user.
[Team page]

[User page]
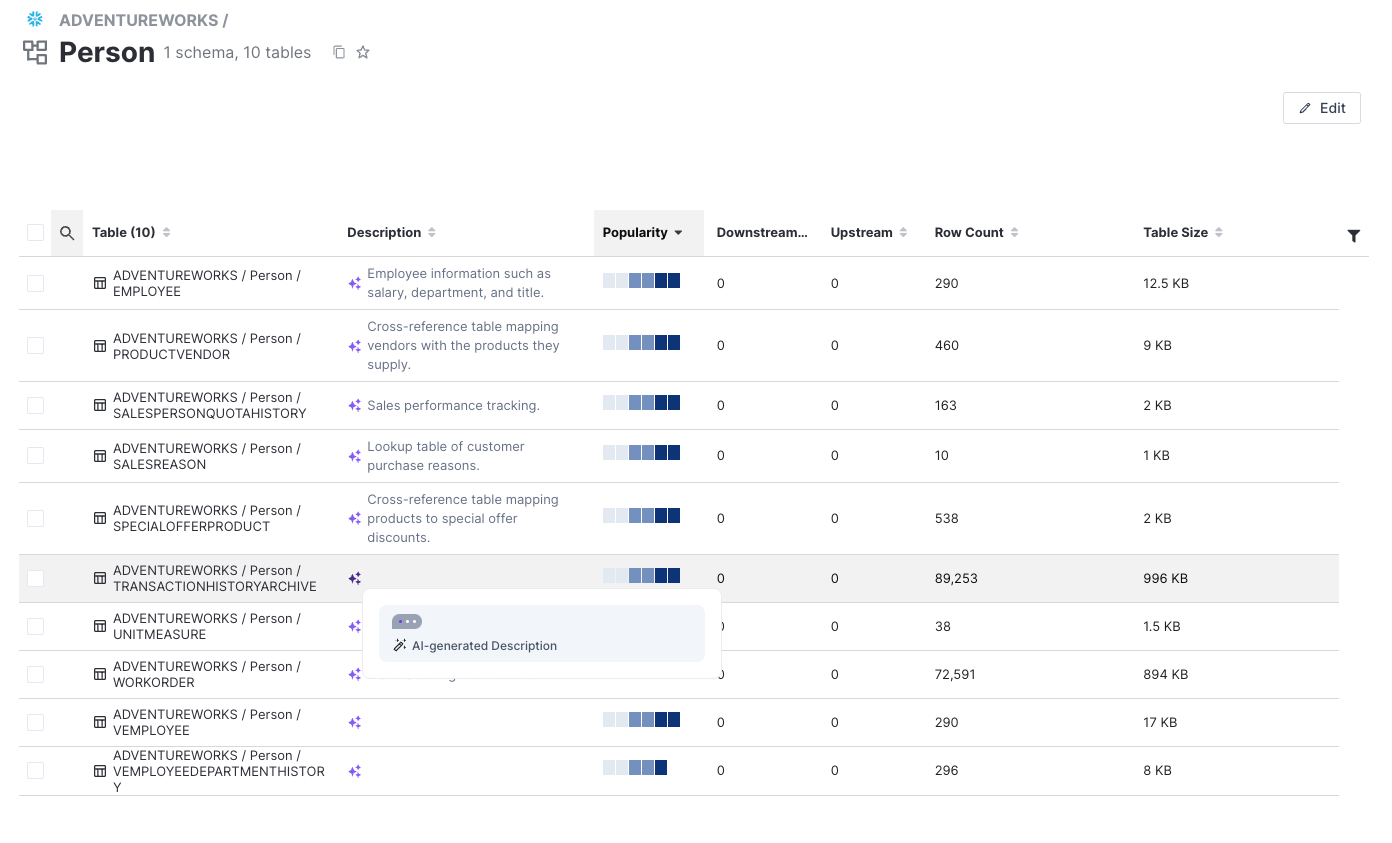
🪄AI Docs for Tables from the Database and Schema Pages
AI Documentation for tables has been expanded to be available from database and schema pages. It was previously available directly on the table page, and now you can quickly generate descriptions for tables directly from the schema without having to navigate to a new page.
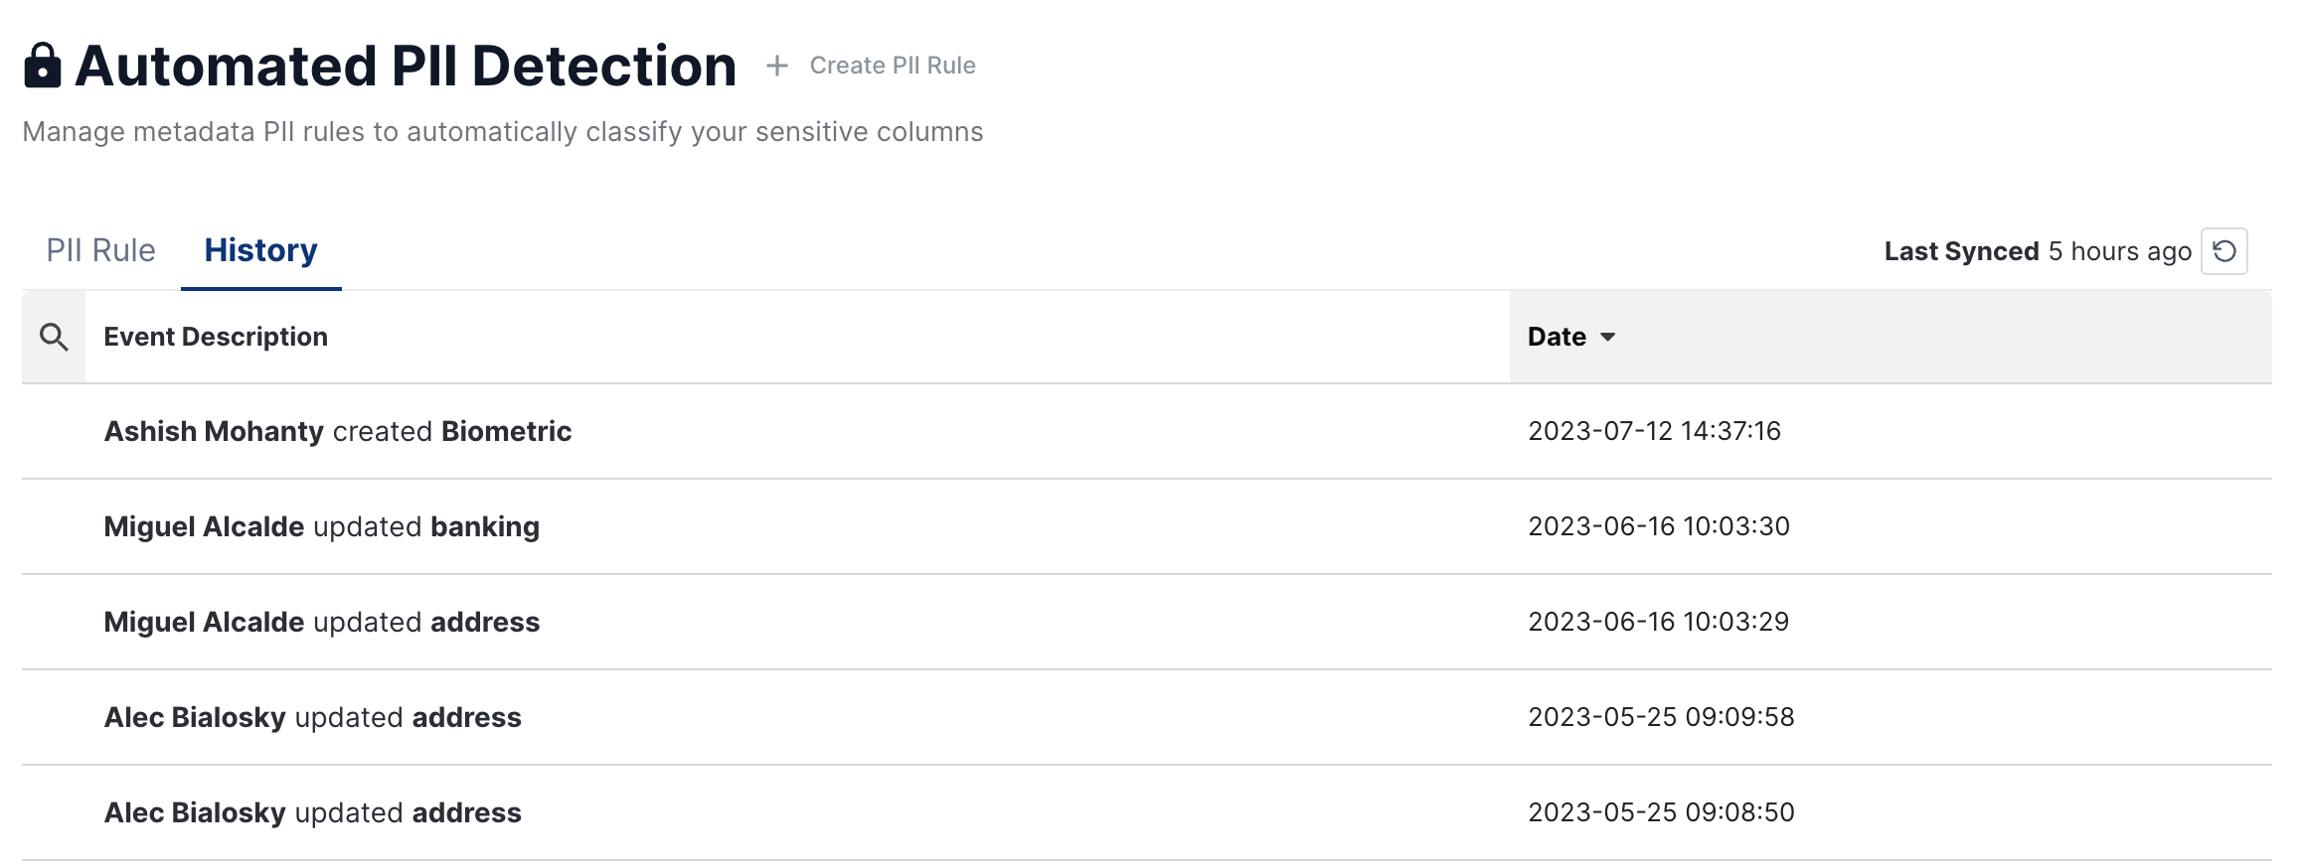
🔐 Automated PII Detection - History (Beta)
Improving upon our automated PII detection release a couple of months ago, we've added an update history so you can easily audit changes to PII detection rules.
Hope you have a great the last weekend of July! ☀️
June 26, 2023 - AI Documentation, Description Source Modal, and Snowflake Cost Analysis
🆕 AI Documentation (Private Preview)
Are you tired of empty documentation pages? Spending too much time filling in the blanks? Let AI help. We are very excited to announce that AI Generated Documentation is now in private preview.
With AI generated documentation, you can quickly generate documentation for tables and columns, backed by OpenAI's chatGPT.

Note: Select Star will send schemas, queries, and existing documentation to facilitate description generation.
👀 See User-defined, Source and Suggested Descriptions
Select Star works to ensure that if there could be a description for an object, there is. We do that by getting descriptions from users, from your data sources, and from suggested descriptions (upstream and downstream as-is lineage, similar tables, etc.).
With this new improvement, you can see each of the descriptions that Select Star has identified, and pick the one that fits best.
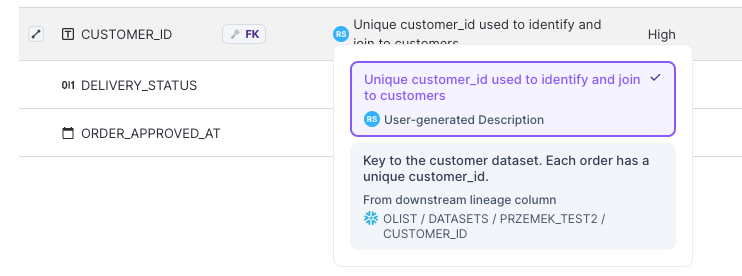
Also, you can retrieve all the description lists from sources in API.
[Column description]((https://api.production.selectstar.com/docs/#tag/columns/operation/columns_retrieve)
Read more on Select Star's Automatic Documentation here.
🆕 Snowflake Cost Analysis (Private Preview)
We are thrilled to announce the launch of our brand-new Cost Analysis feature, designed to help you manage your Snowflake Spend. With Cost Analysis, you gain visibility into your Snowflake compute spend by query, dashboard, user, and team, enabling you to understand how to maximize the value derived from Snowflake.
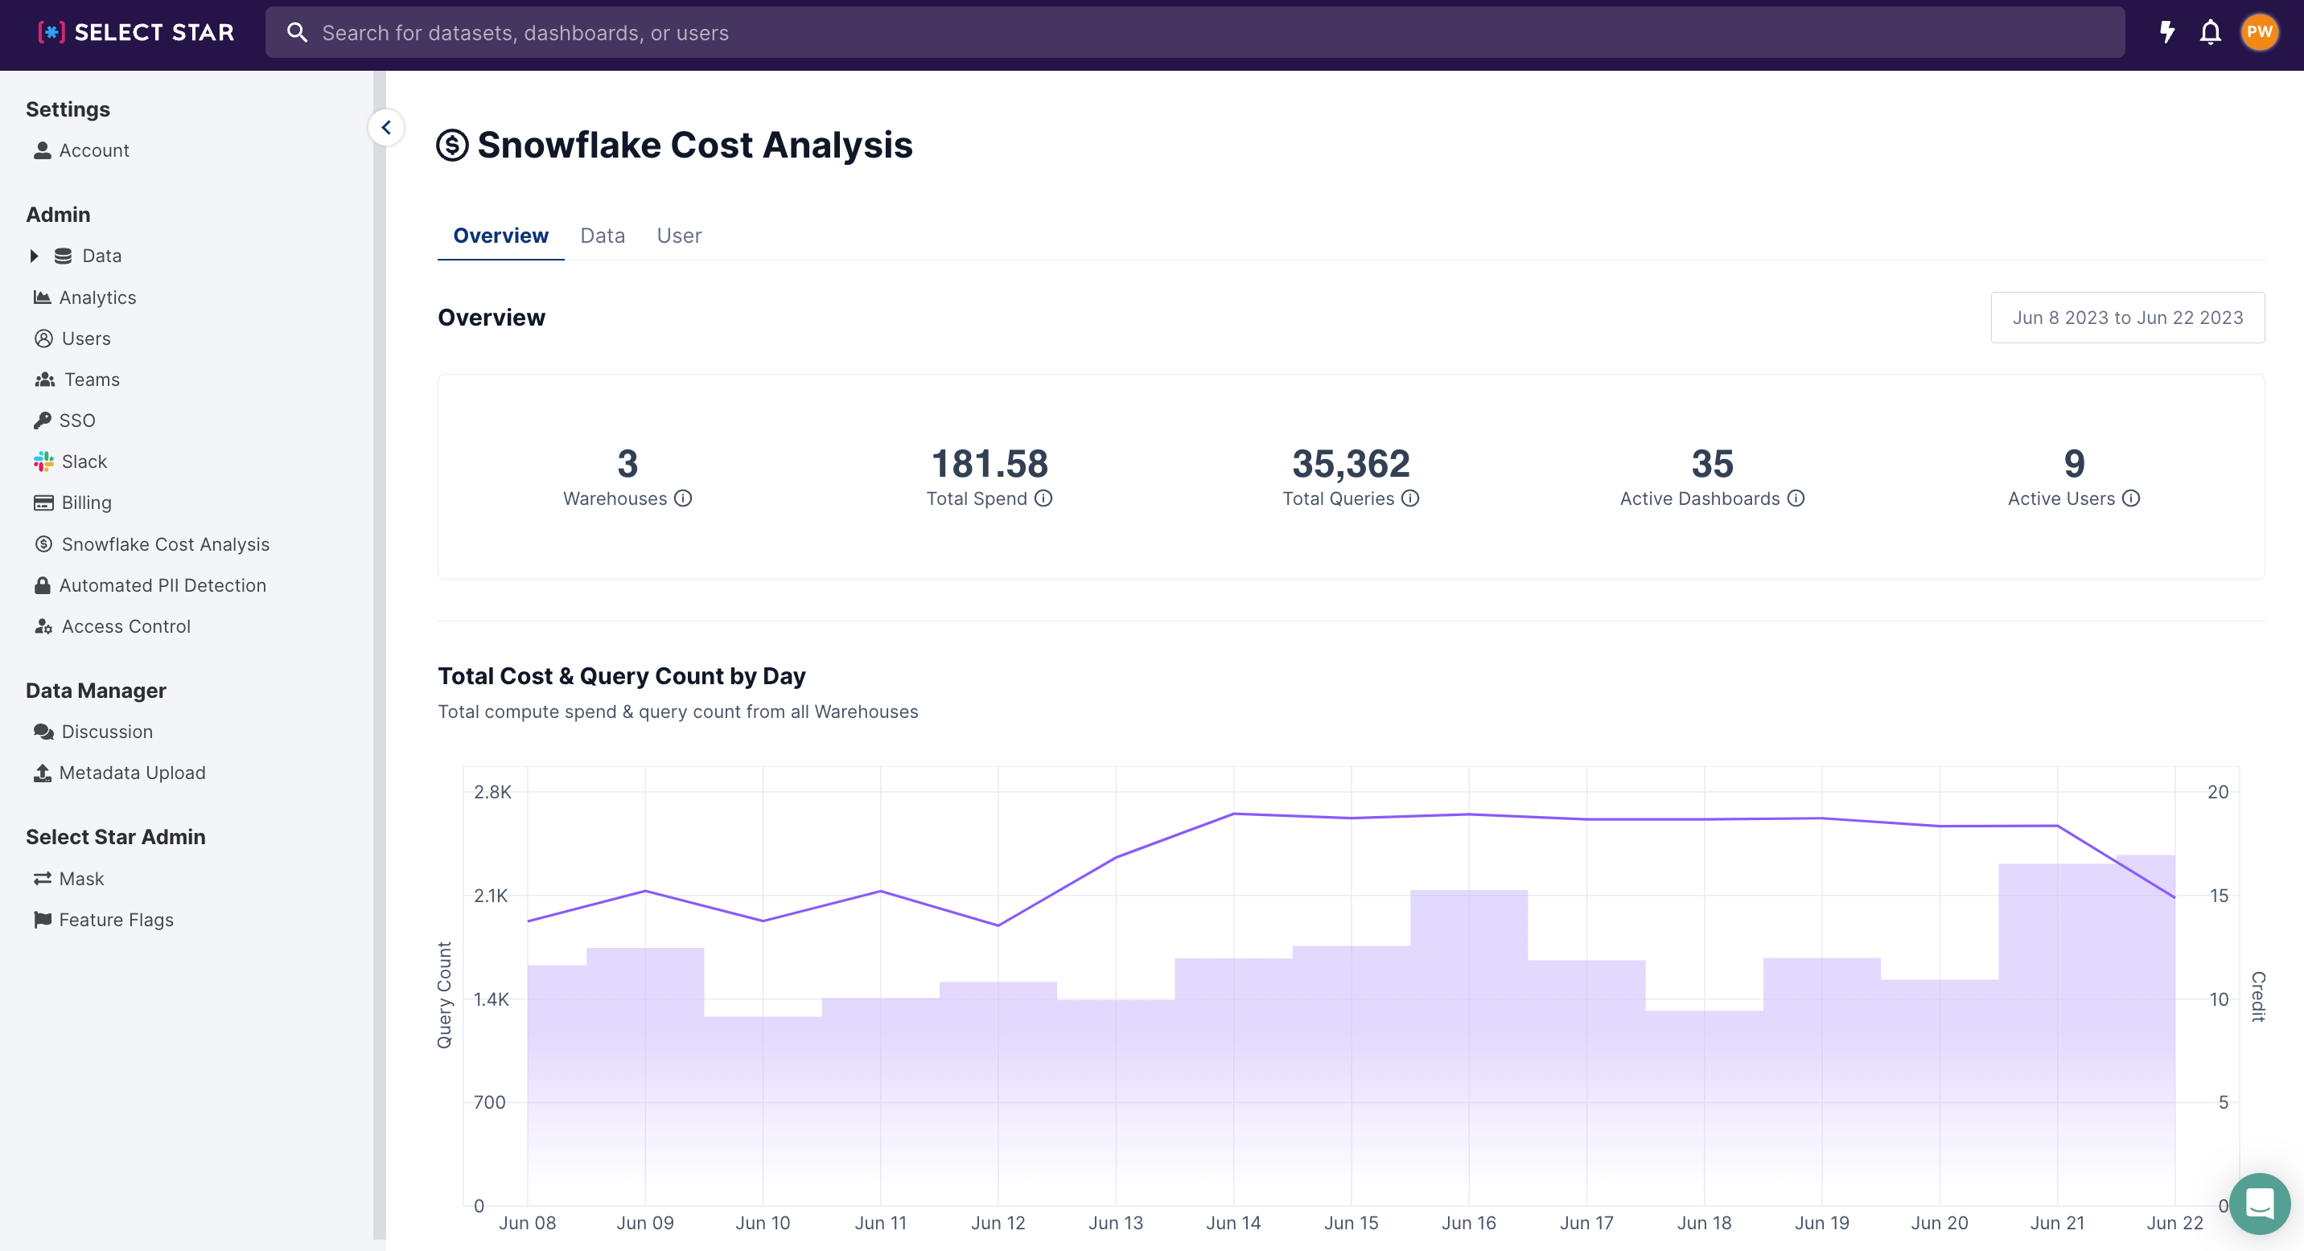
Reach out to [email protected] to get access to AI Documentation or Cost Analysis.
June 9, 2023 - Custom attribute rich text/markdown support, PBAC search filter, Source table count on dashboards and more!
We hope everyone is having a good summer so far! We're working hard to bring some exciting news in June and can't wait to announce new features. Before then, we'd like to introduce some improvements that will help your day-to-day.
🖊️ Rich Text/Markdown Support for Custom Attributes
Now you can use rich text or markdown in custom attributes, adding styles like bold text and links. This styling can be implemented in the UI and by API. Now your custom attributes can look as beautiful as you've always envisioned them.
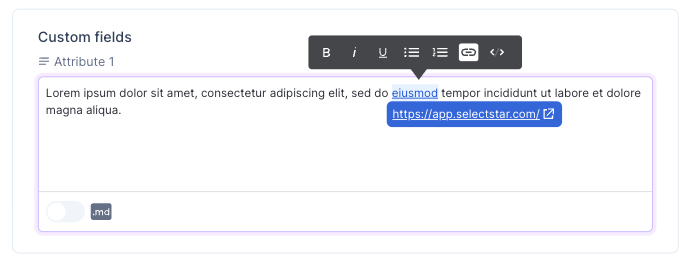
For more details: Link
💡 Source Table Count on Dashboards, and Downstream and Upstream Counts on Tables
Having source table count on dashboards assists data scientists and engineers in delivering reliable and meaningful insights, ensuring data accuracy, enabling data traceability, and supporting data governance.

Having downstream and upstream views in the database and schema pages provides our users with valuable information about the data flow and lineage within the system. Sorting them to get a bird's-eye view of how your data is consumed and transformed within your organization.

➕Policy-Based Access Control Search Filter
Better search always improves one's experience. We are excited to enhance your PBAC policy creation with our fancy new search component which allows users to filter by object type to quickly find what they’re looking for.
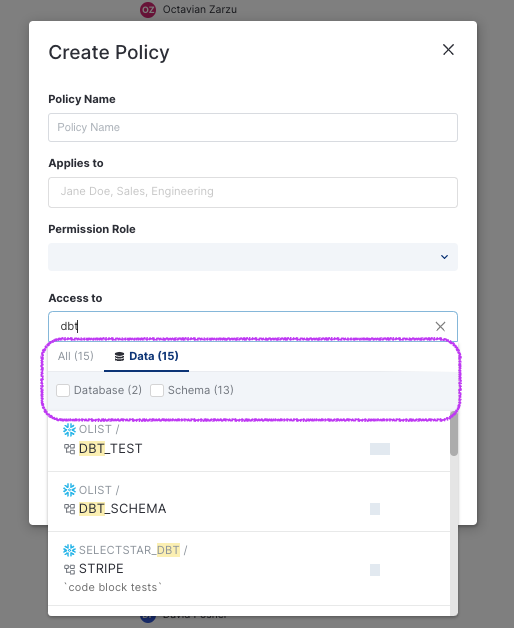
➕Improved Metrics Support
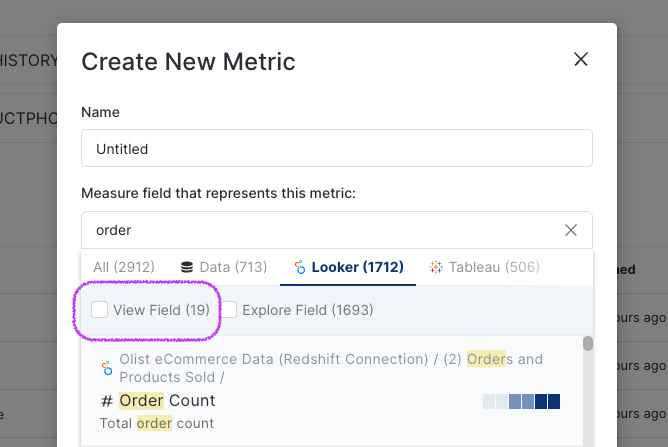
Now, we support Looker View field as a metric dimension, and you can use the search filter in the 'Represented as' section.
May 9, 2023 - Automated PII Detection, Markdown Support, and AWS S3 & Glue Integrations
We are excited to announce the latest release of new features & improvements:
Automated PII Detection (Beta)
Select Star's Automated PII column detection is a feature that automatically detects columns in a dataset that contain personal information such as names, addresses, social security numbers, and other identifying data. This helps organizations comply with privacy regulations and enhance data security while saving time and resources.
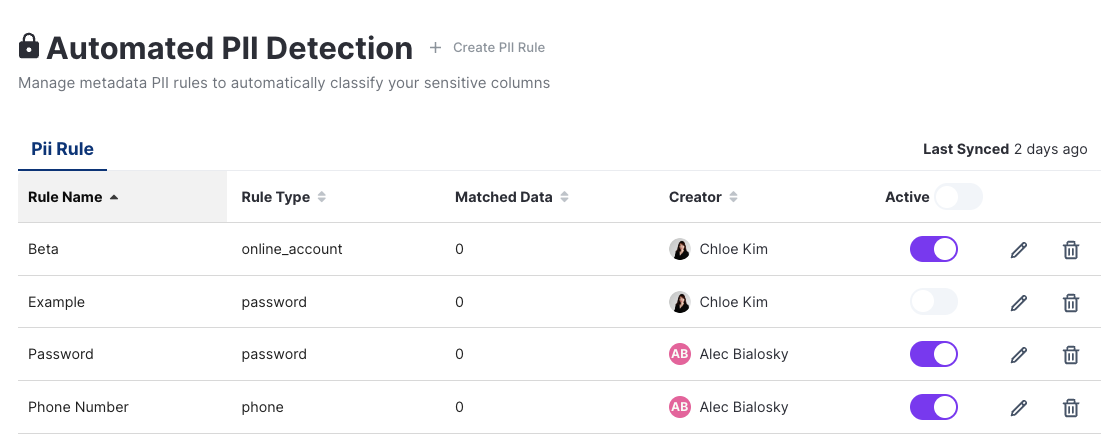
You can check more info here. This feature is currently in beta! Please reach out to [email protected] to activate this feature.
Markdown Support
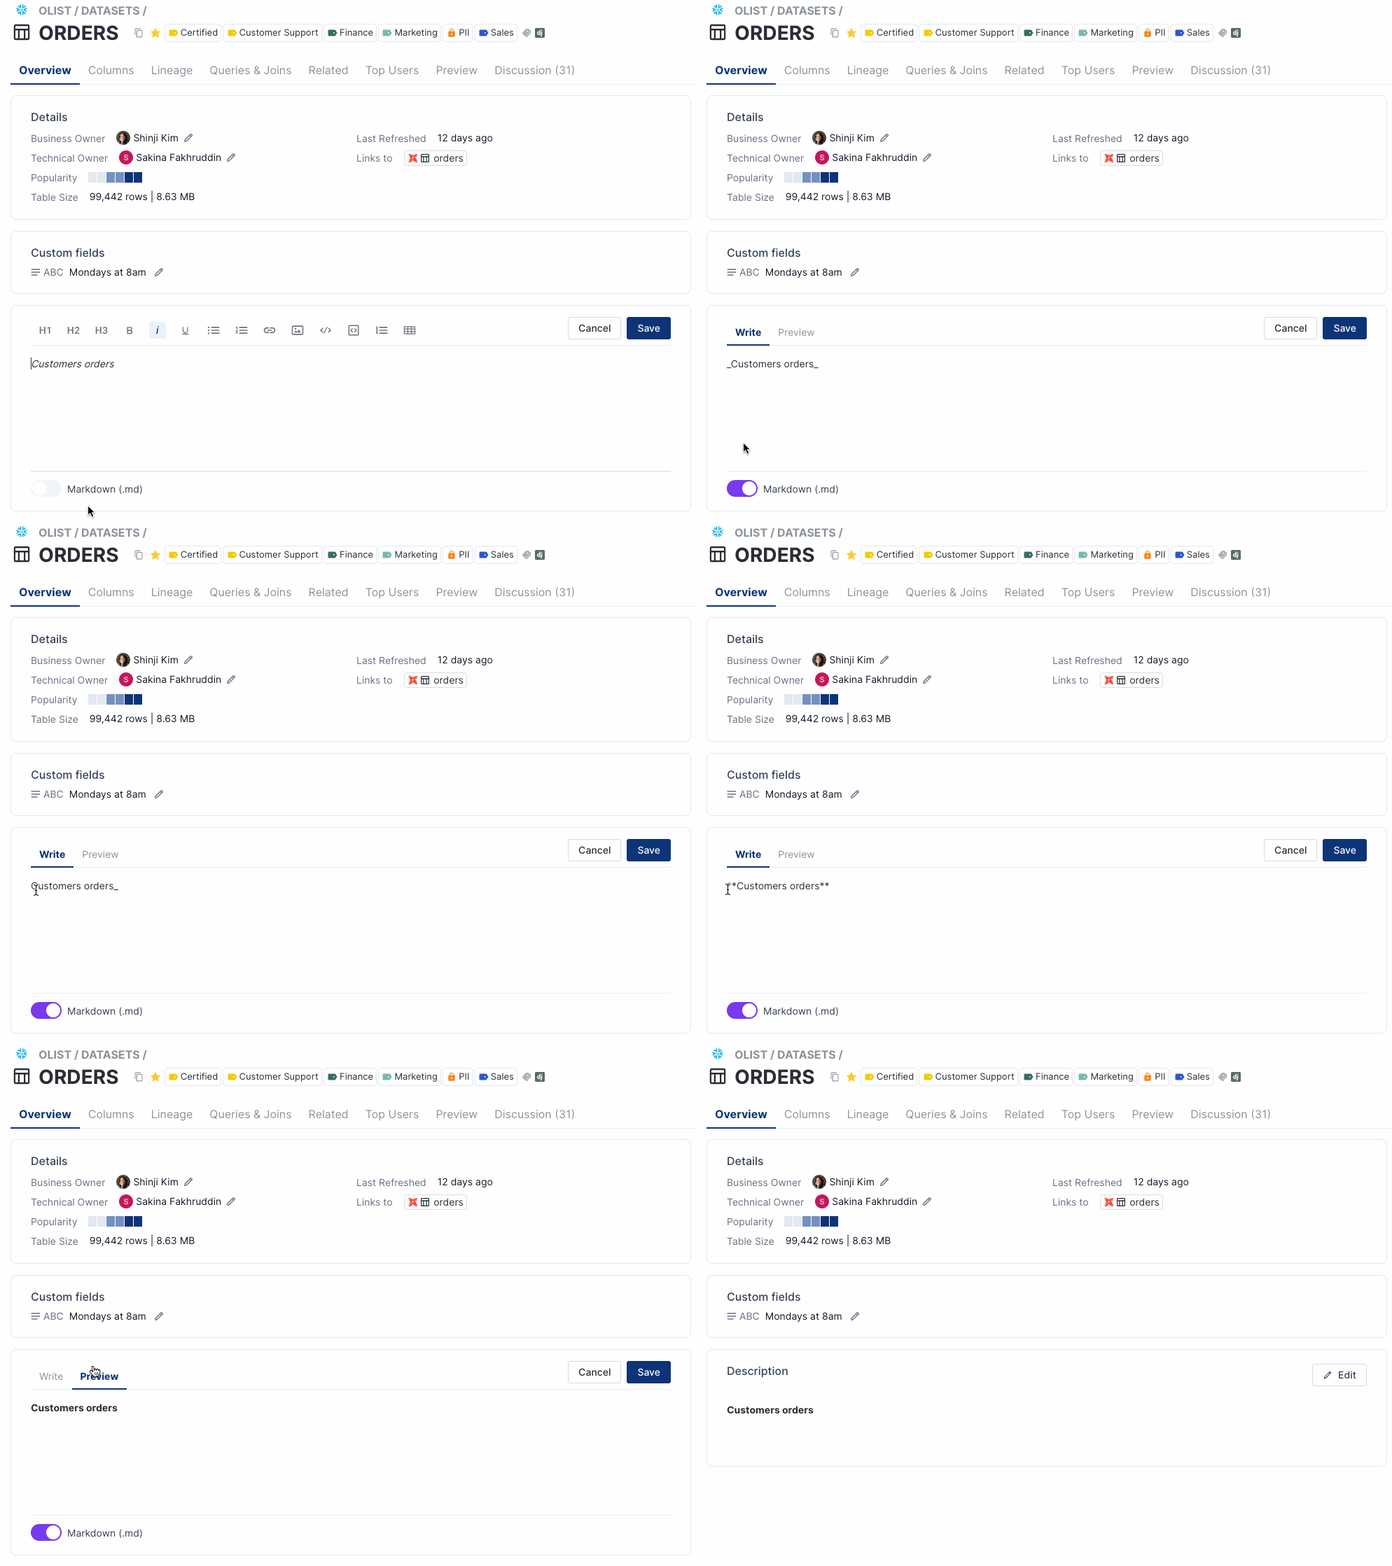
Our main documentation feature now includes strong support for Markdown formatting via API. With this new release, you can now create and edit Markdown-formatted content programmatically, using our API.
You can also use markdown to write the descriptions by clicking on the markdown toggle at the bottom of the editor. Learn more about this support here.
Updating rich text descriptions via API
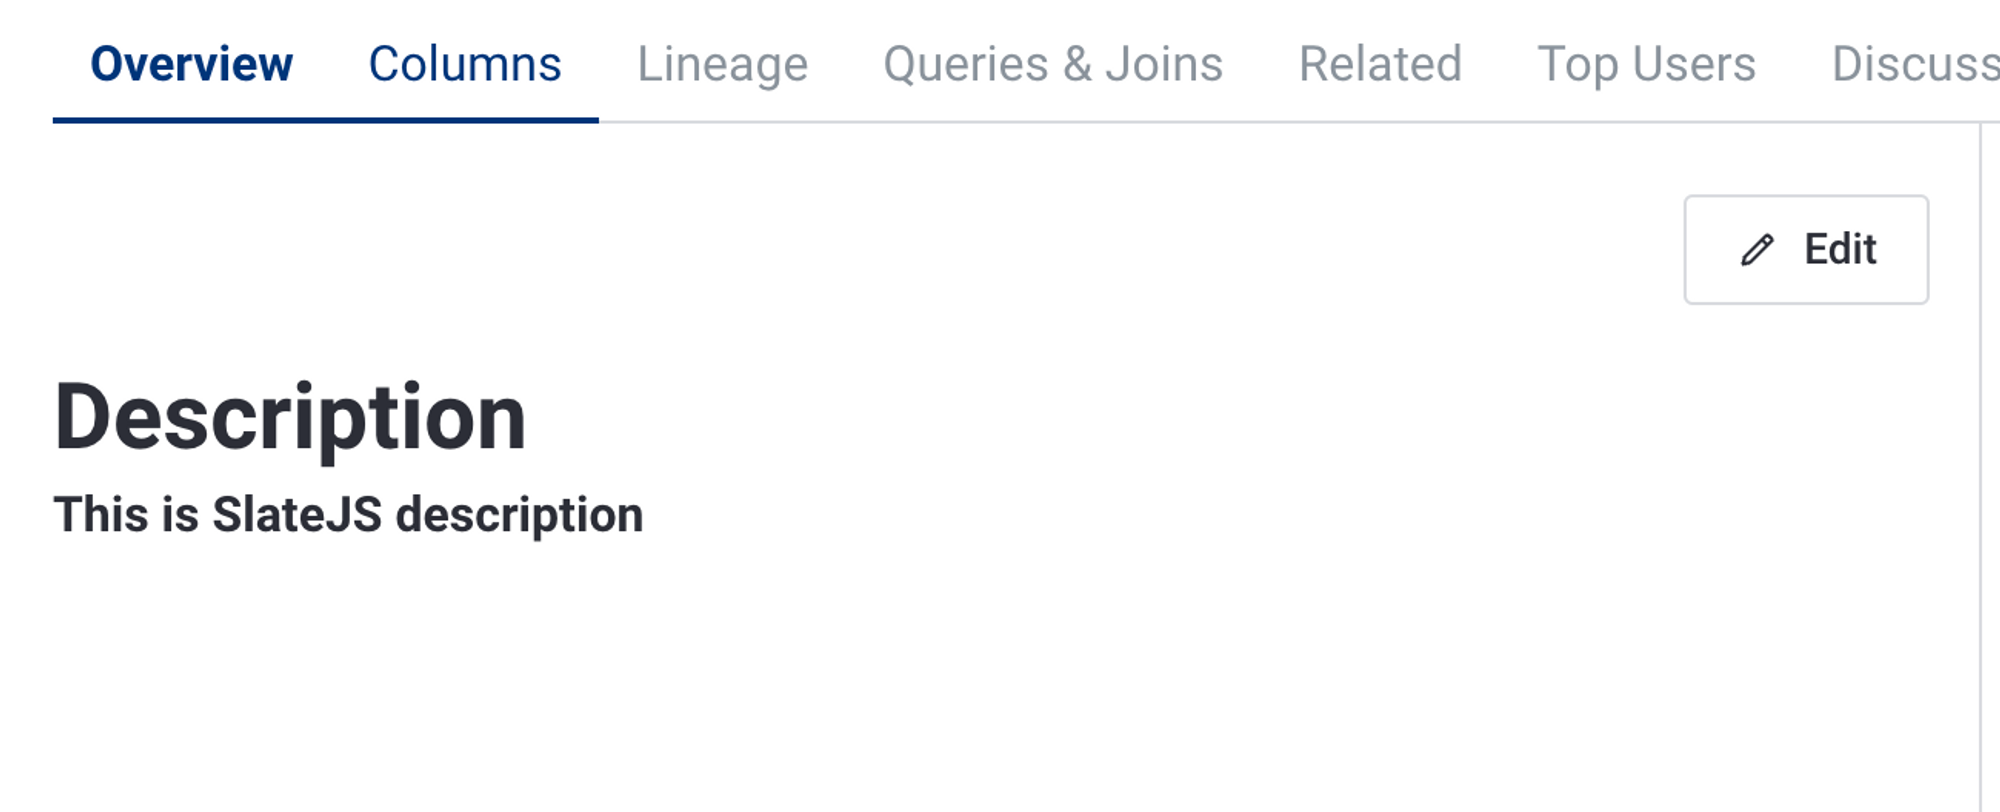
Select Star now supports both SlateJS and Markdown for formatting text in rich text descriptions. To update the rich text description field via API using SlateJS format, you need to send a PATCH request to the API endpoint with the updated content in SlateJS format.
Example
Here is an example of a Python script making a request to update a rich text description:
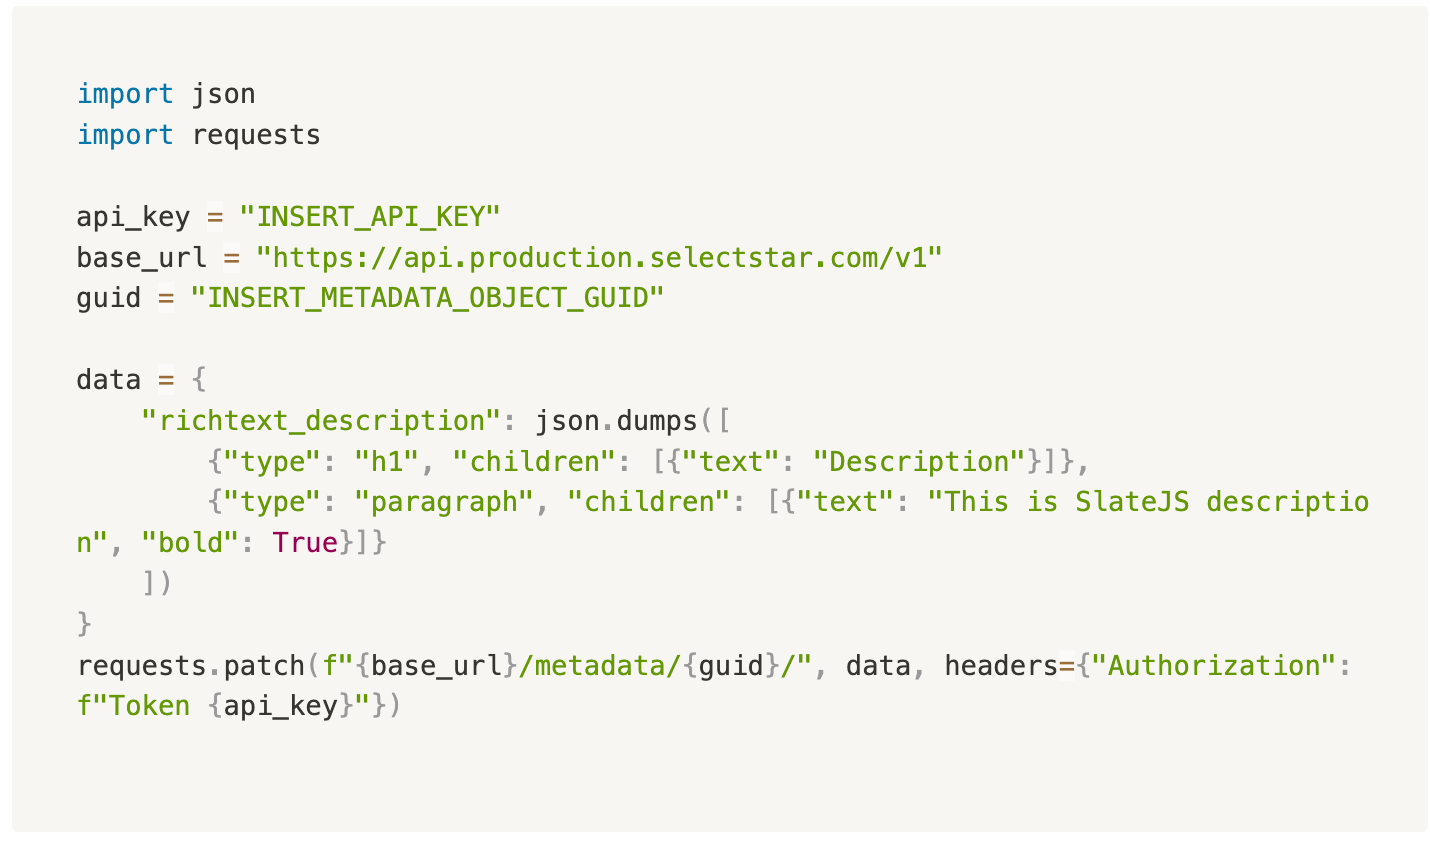
After making this request, you’ll be able to see this in the Select Star platform as a result:
🧩 S3 Support
Our team has been hard at work to display S3 lineage for Snowflake tables. So, if a file (CSV, JSON, etc) was ingested by a Snowflake table from a S3 location, you can now see the lineage in the Upsteam tab and in Lineage Explore. 🎉
Upstream - 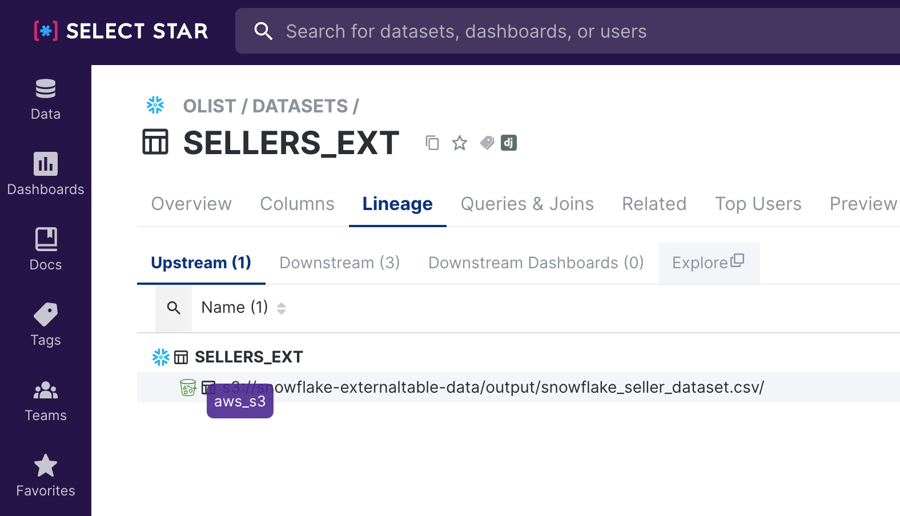
Lineage - 
Snowflake External Table and Stage support coming soon!!
🚀 AWS Glue Integration (Beta)
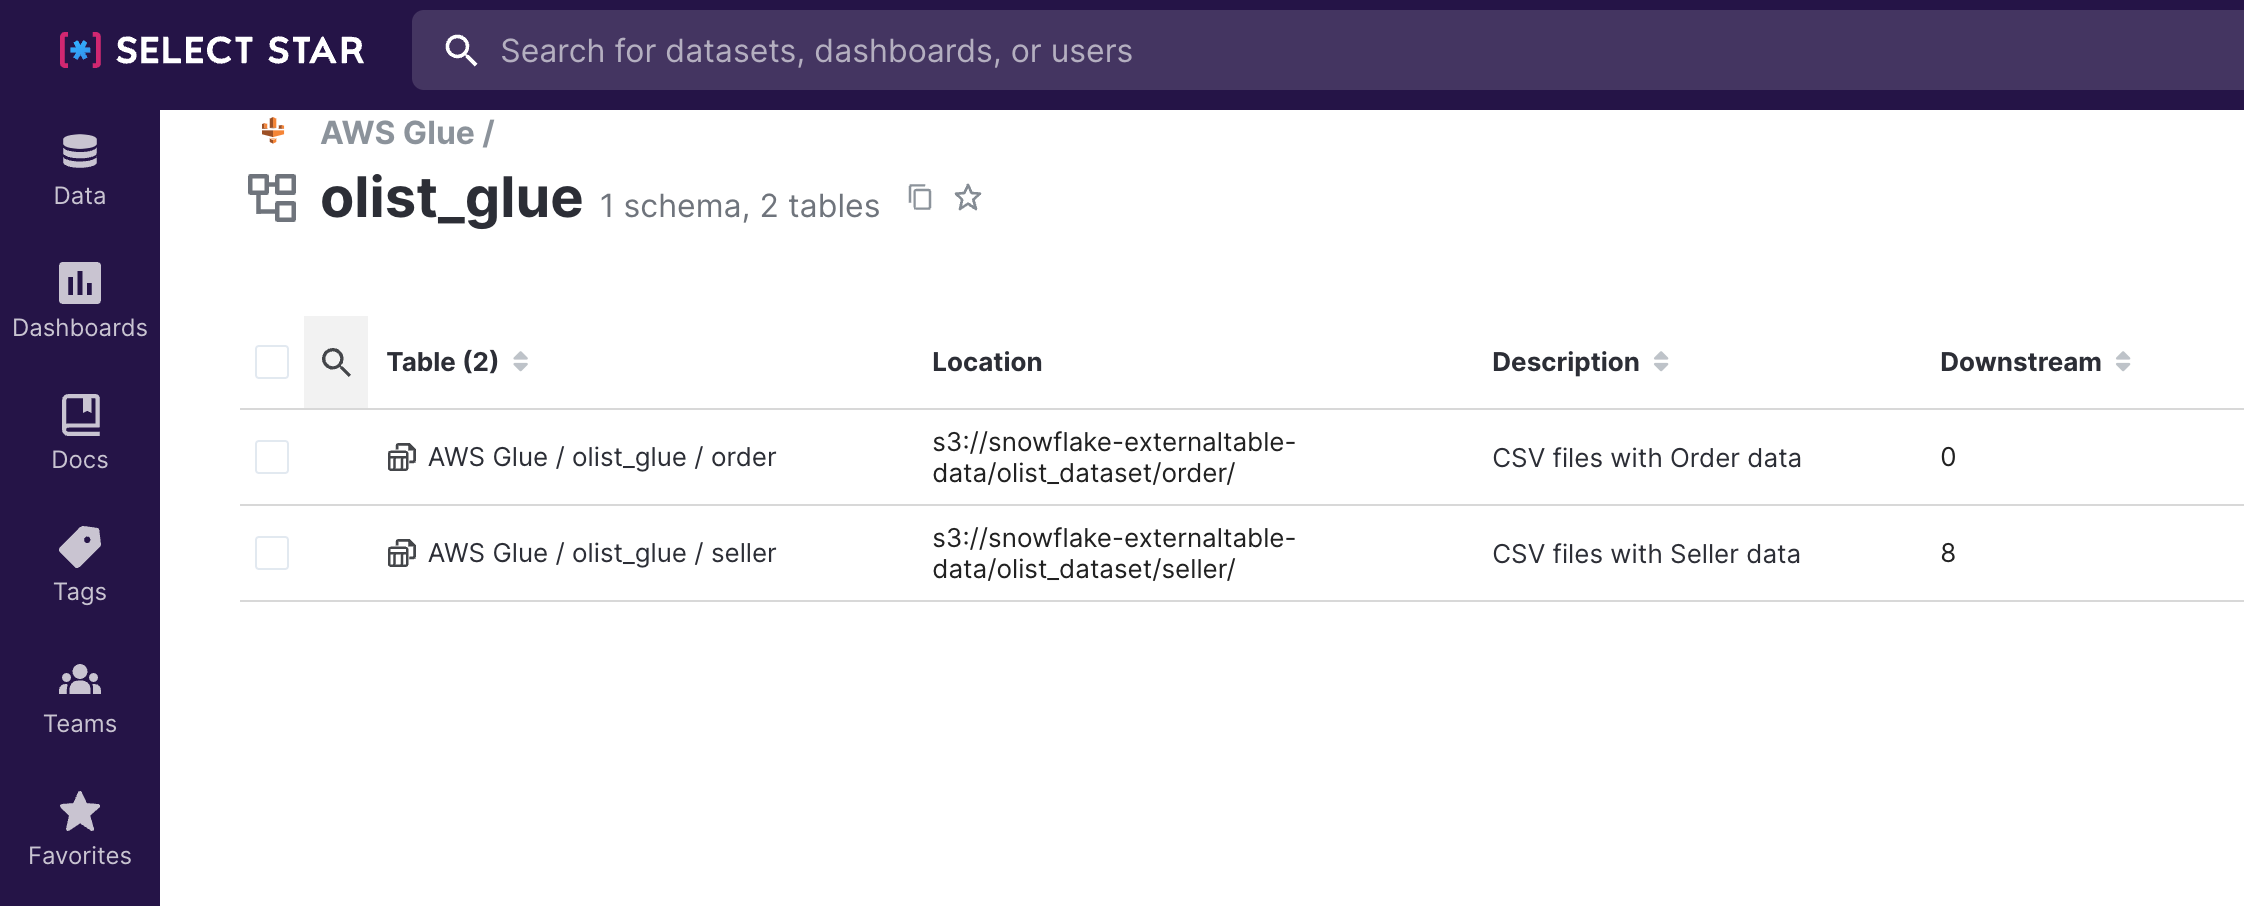
Along with support for S3, we are also launching the new integration with AWS Glue. With this integration, you can view the databases and tables in your AWS Glue environment and you'll be able to see downstream table lineage for your Snowflake tables.
List of AWS Glue tables with location -
Downstream -
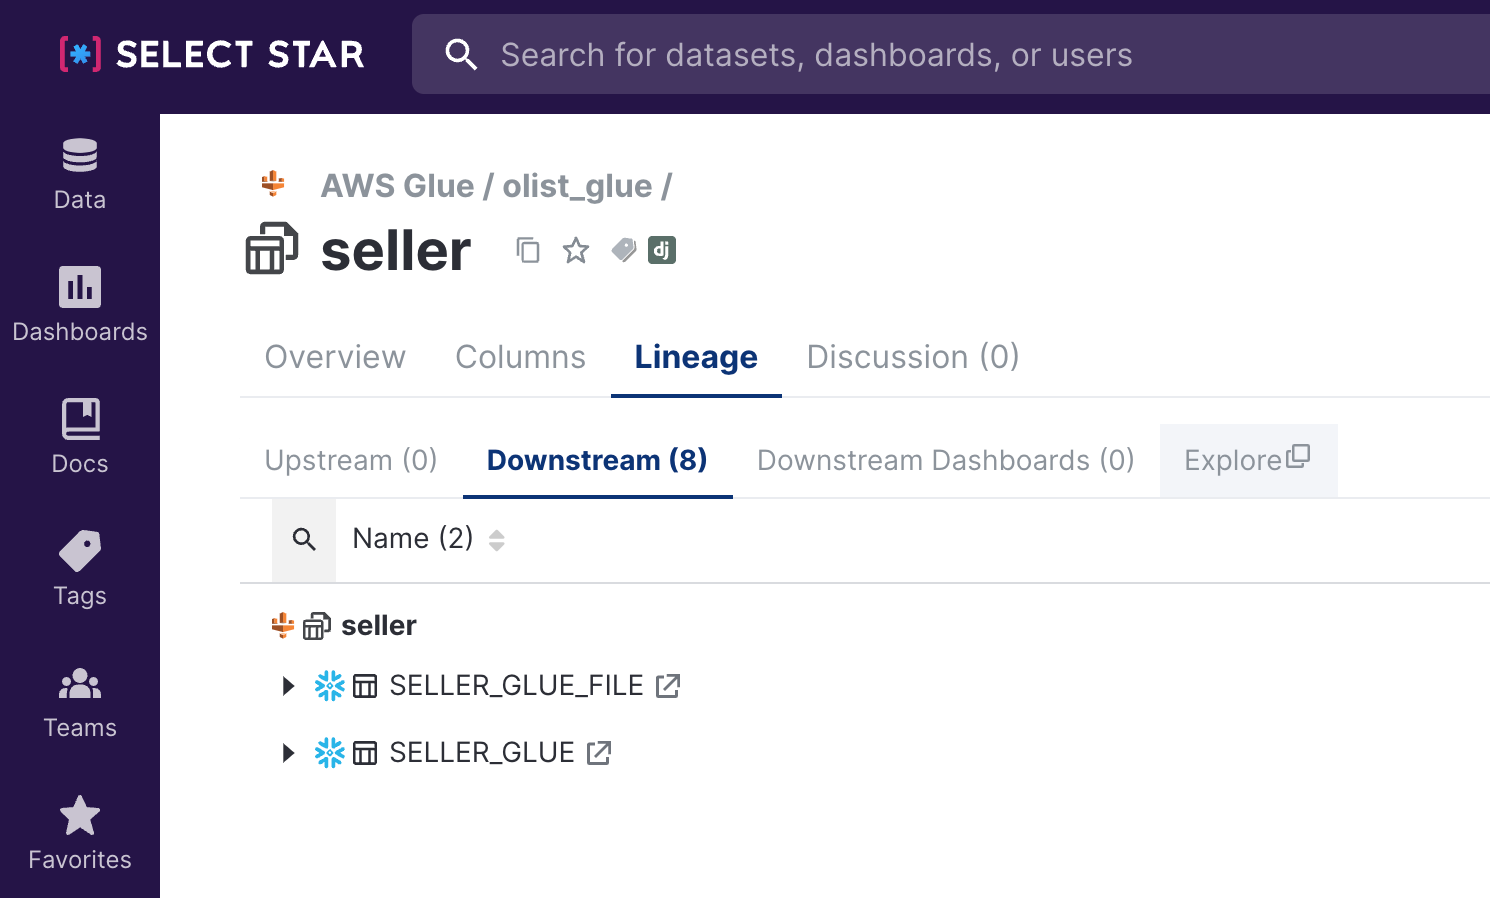
Lineage -

Learn more about our AWS Glue integration in the doc.
Have a great day!
-Select Star Team 🫶
May 1, 2023 - API Updates and Tableau Updates
🏷️ API updates
We recently released a new feature to get GUID of schema, table or column when a full path is provided in the API call.
Example request -
GET https://api.production.getselectstar.com/v1/tables/?page=1&page_size=1&search_name=Snowflake.NewAdventureWorks.Person.Address&query={guid}&order=-popularity
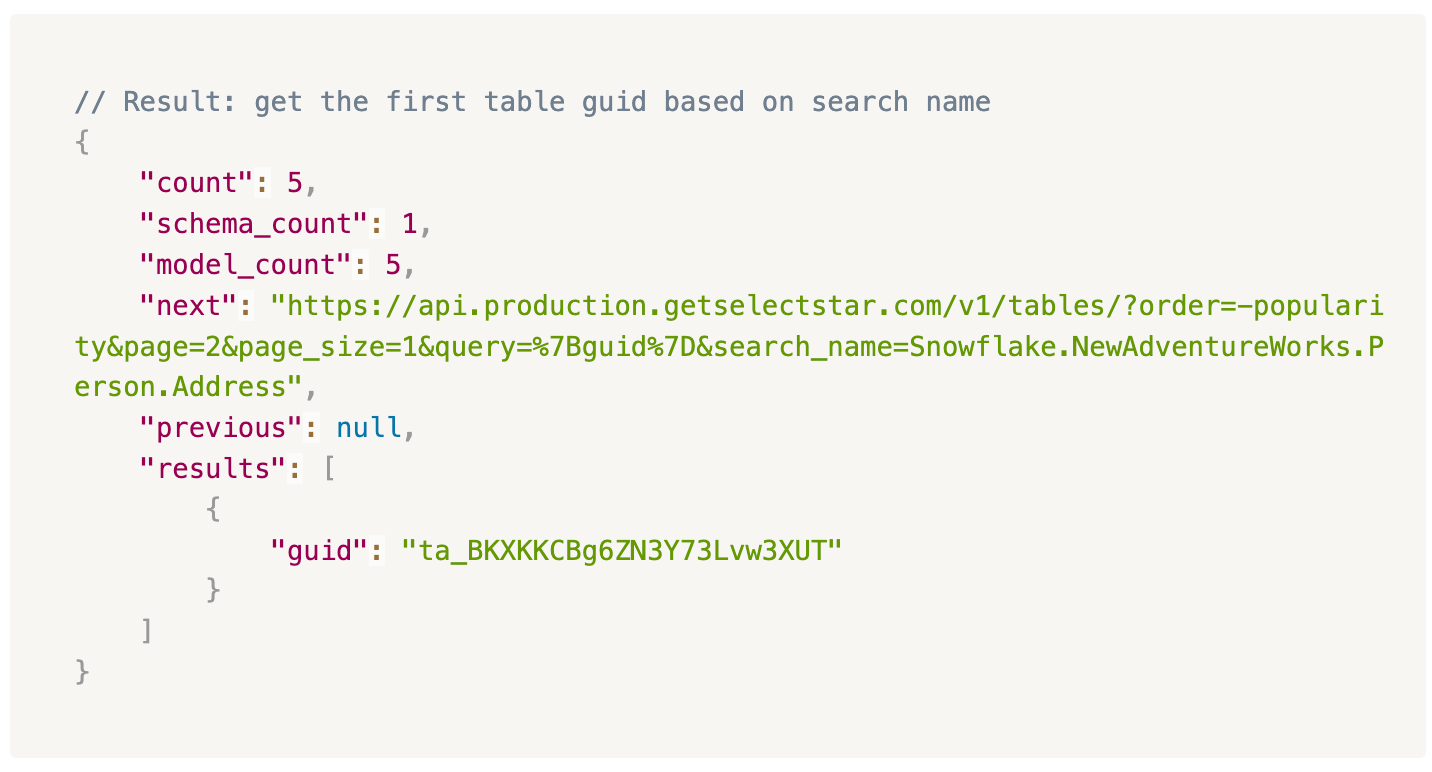
In the example - Snowflake.NewAdventureWorks.Person.Address is {Select Star Data Source Name}.{Database}.{Schema}.{Table}
You can also use the columns endpoints to get the GUID for a specific column.
🔥 Tableau Updates
Based on our user feedback, we are introducing updates to our Tableau integration:
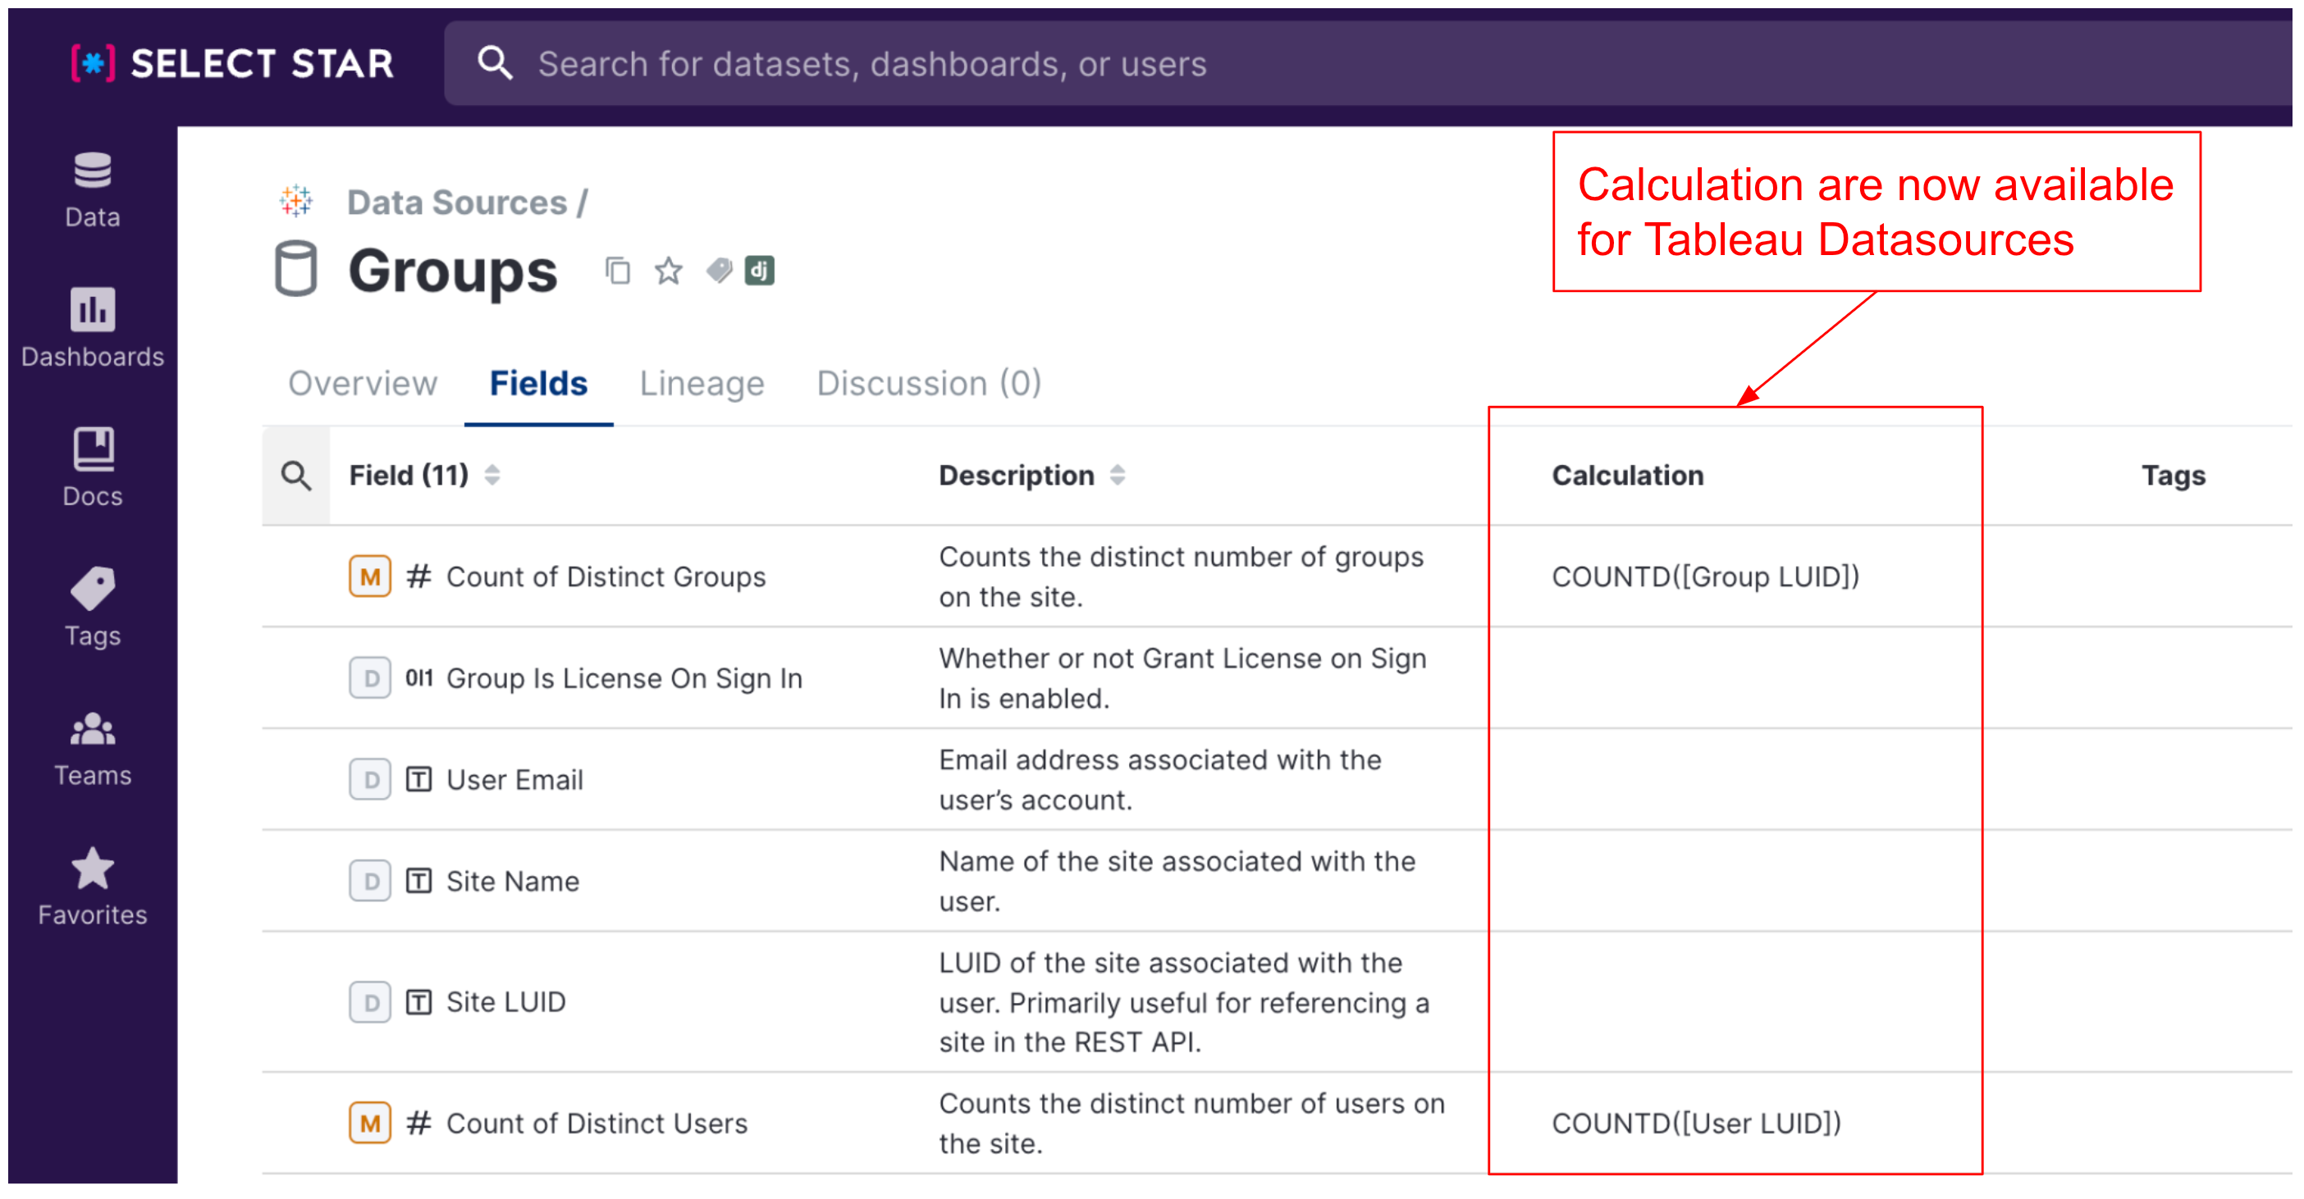
Display underlying calculation for Datasource Fields We now show the underlying calculation for Calculated Field within a Tableau Datasource.
Only show Published Datasources as default Some of you requested to only show the Published Datasources by default on our Tableau Datasource.
You can still view the embedded Tableau Datasources by checking the checkbox on the right.
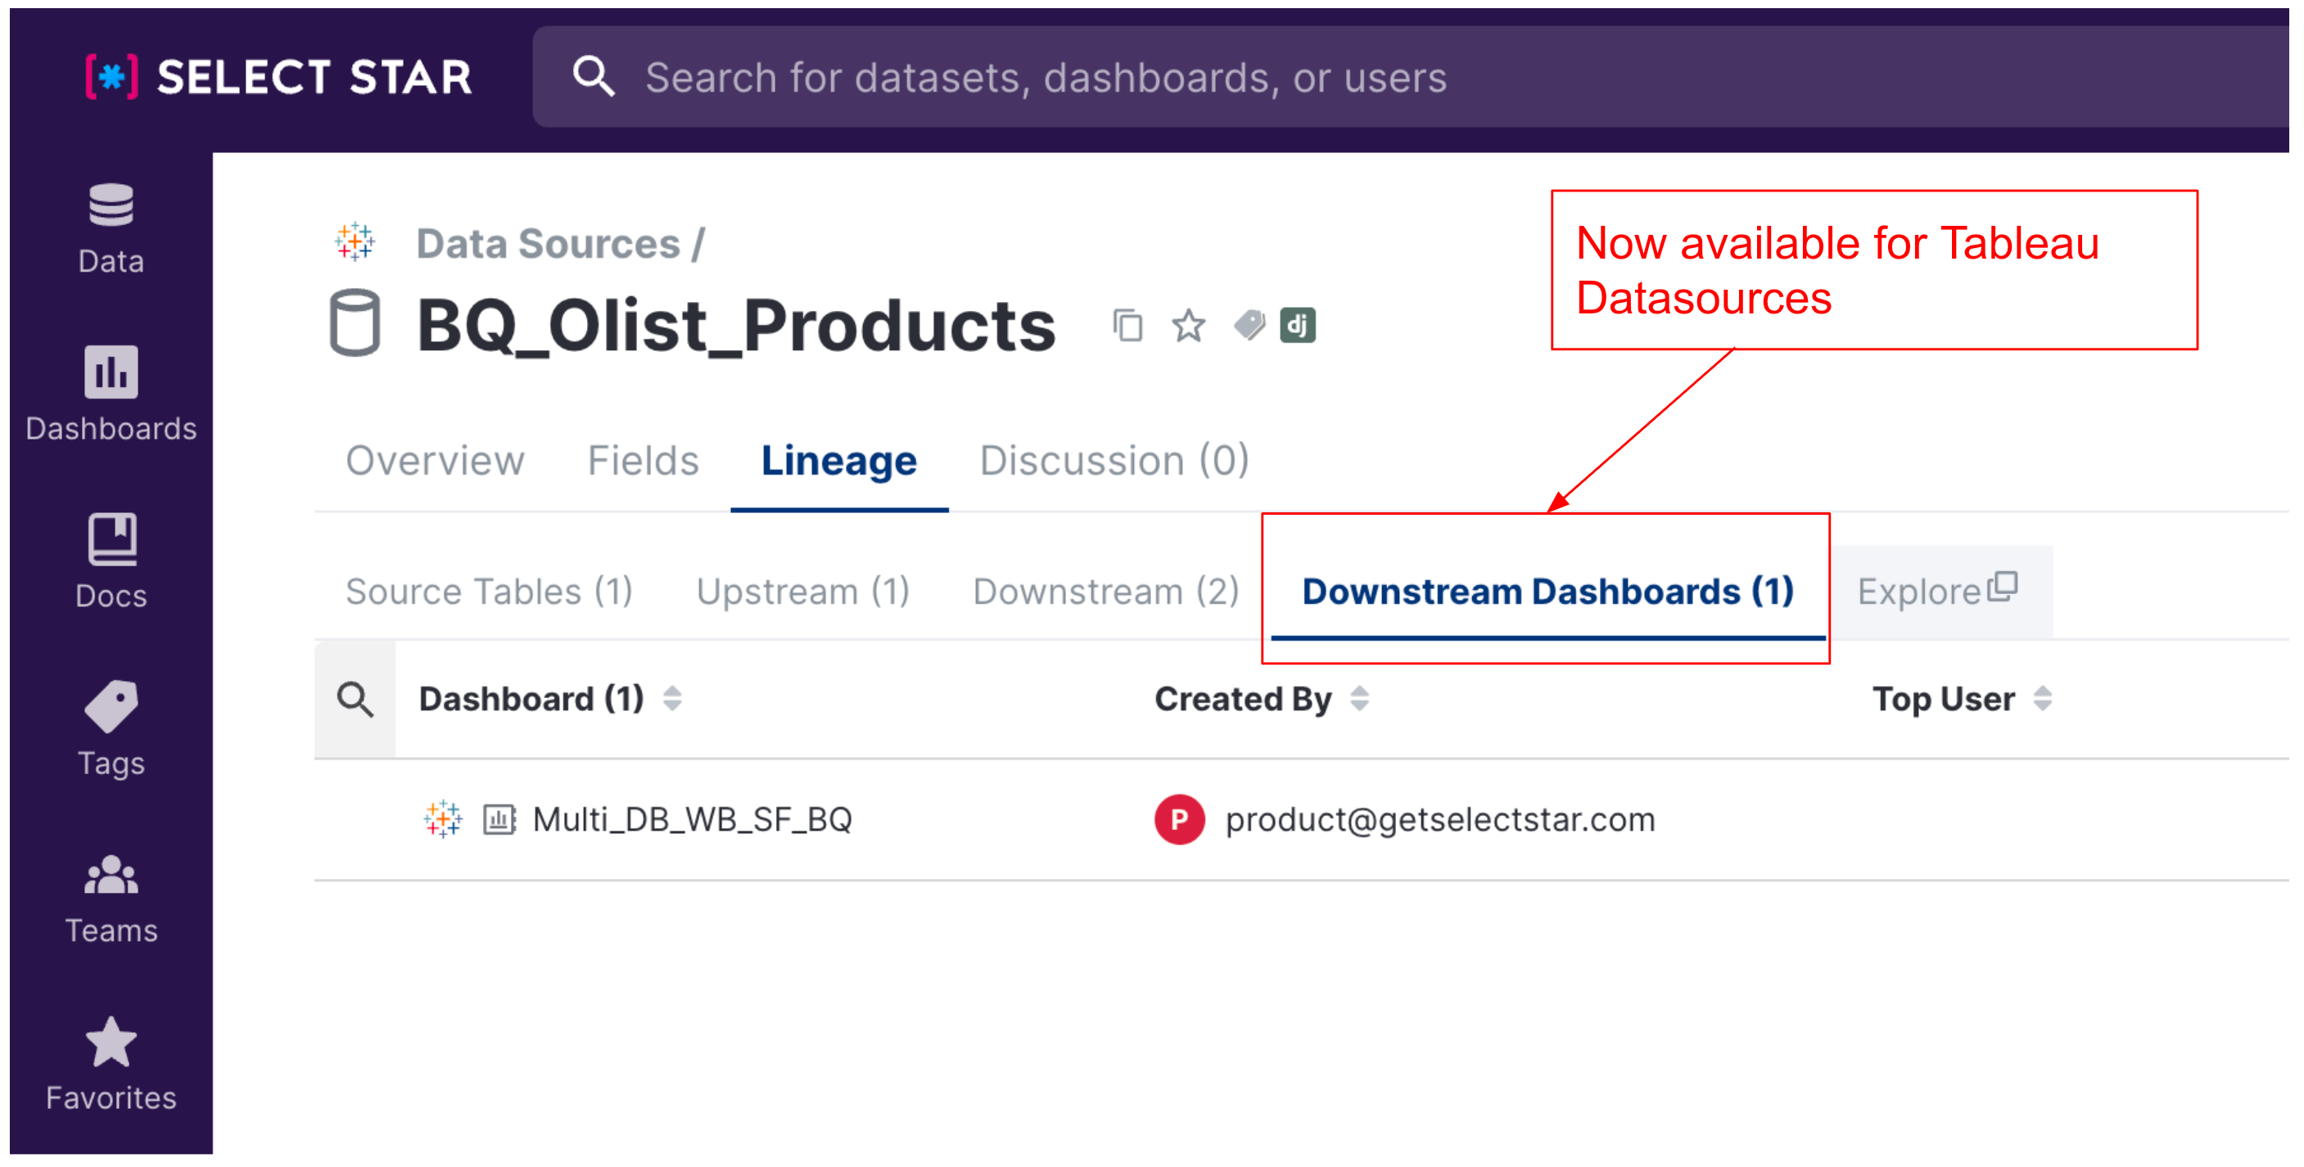
Display Downstream Dashboards for Tableau Datasources You can now quickly see all the Tableau Workbooks utilizing a specific Tableau Datasource (for both Published and Embedded).
View SQL for Custom SQL based Datasource With this update, you no longer need to manually edit the workbook to view the SQL. We have improved the process of accessing the SQL that powers Custom SQL-based Tableau Datasources, making it more convenient for you.

We hope these updates will improve your experience with Select Star. Please feel free to share your feedback and suggestions with us. Have a great day!
-Select Star Team 🫶
April 18, 2023 - 🌸 Enhanced Overview Section with New Font Update
We are thrilled to unveil an exciting update to our application's font and overview section to provide better readability of table / dashboard pages:
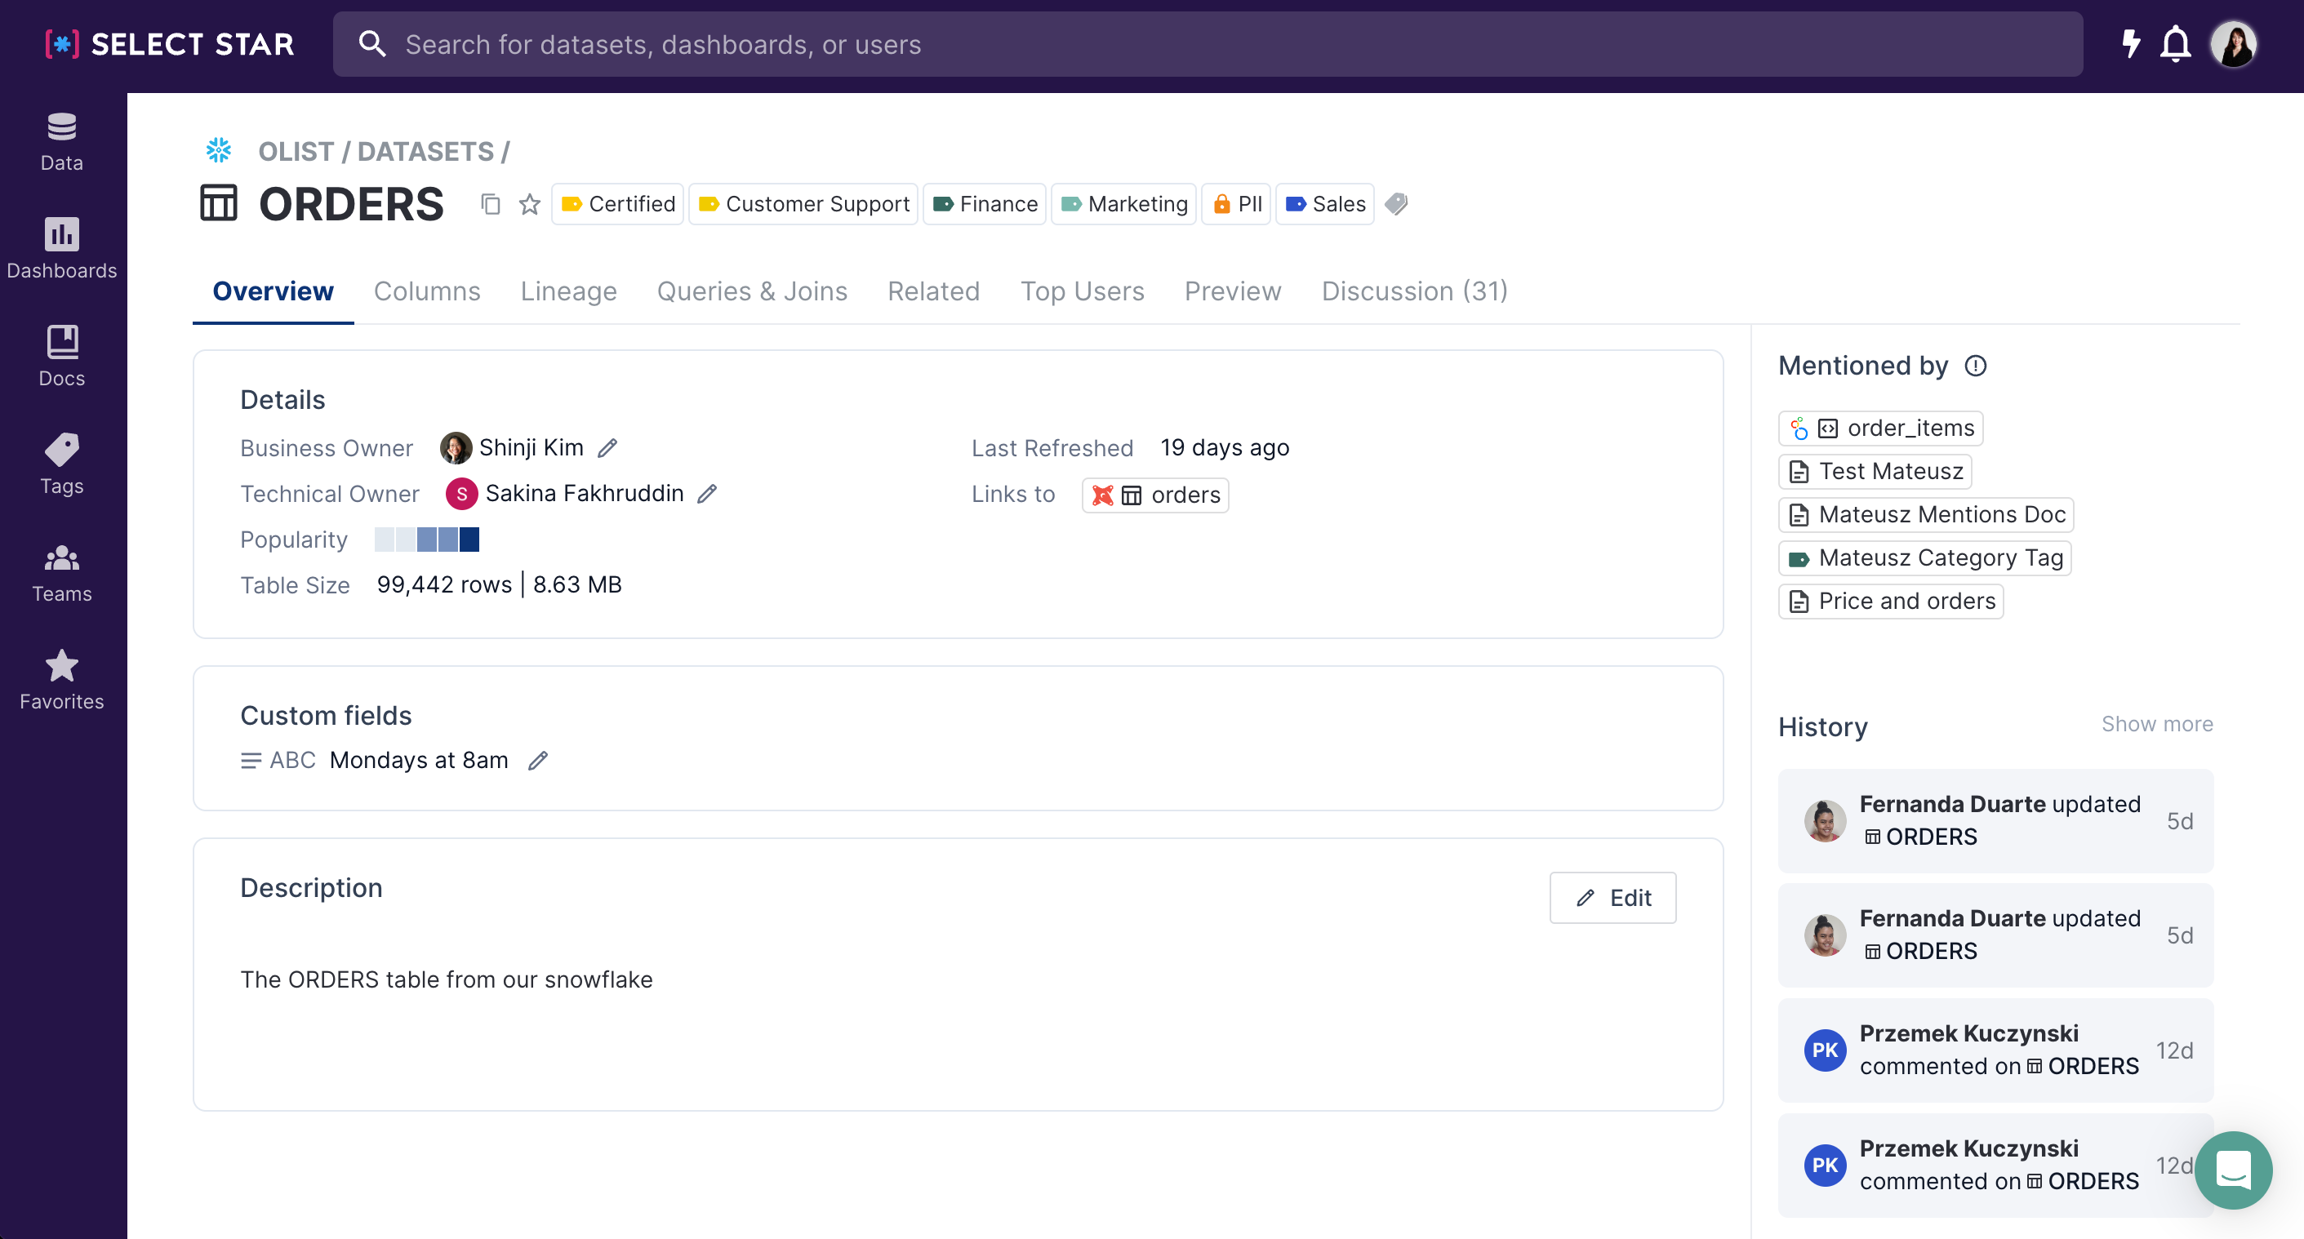
We're putting the ownership and popularity information front & center. Also improved how this will show on smaller screens / mobile:
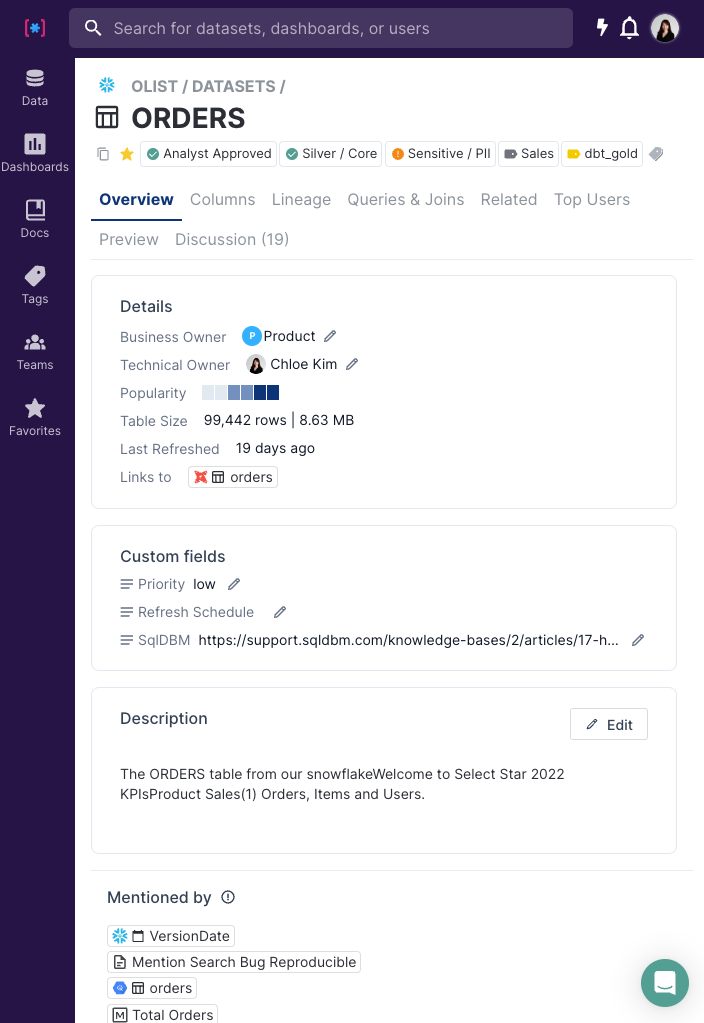
As we embrace the spring season in full bloom and approach the summer, we hope you will enjoy the beauty of this wonderful time of year to the fullest. 🌸🌷
Thank you for your continued support!
Marcy 31, 2023 - User Analytics API, Power BI Updates and Export to CSV
👉 Power BI Updates
We are happy to announce that we have made significant changes to our Power BI integration and we now support Datasets, Reports and Dashboards, and column level linage across them.

Learn more in the doc.
👥 Analytics API for Activity Logs
This week we launched the highly requested Analytics API for Activity Logs. Previously, you were only able to view the user analytics under the Admin section, and now with this API you can get the user activity log based on various filters like start_date, end_date, types, user, etc.
Example request -
GET https://api.staging.getselectstar.com/v1/data-metrics/activities/?start_date=2022-12-01&end_date=2022-12-25&types=update
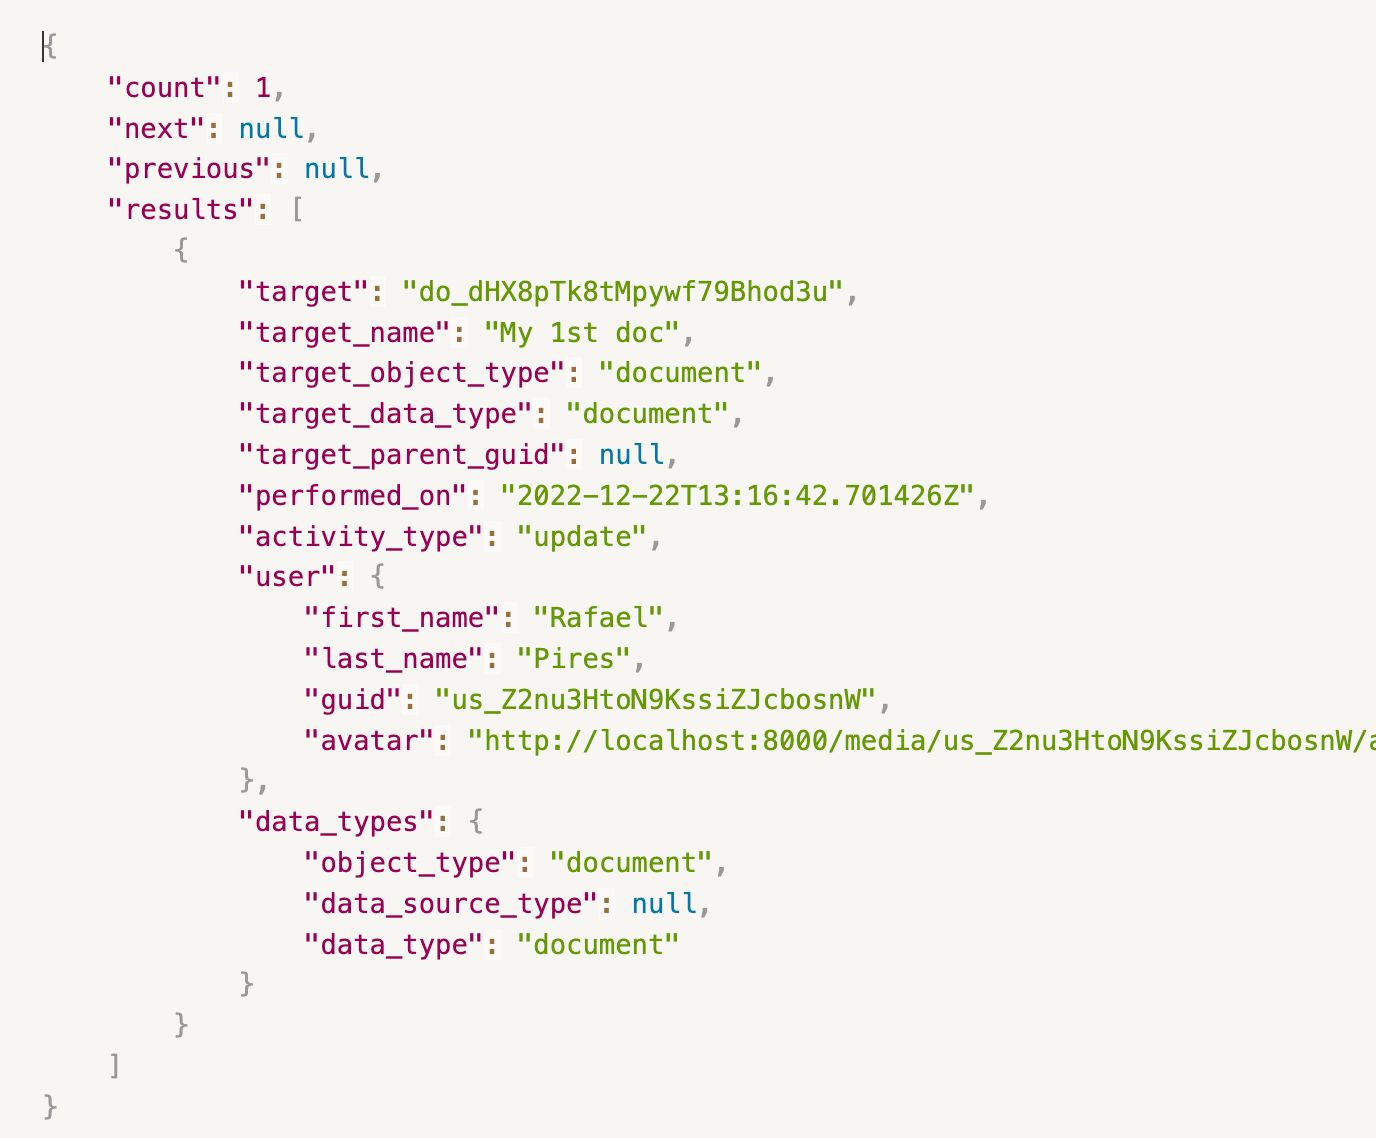
Learn more about our API and the list of filter values in the doc.
✨ Export to CSV for Database page
Lastly, we also launched a feature to provide you with the ability to download the list of all the selected tables for a database or a schema.

CSV structure currently includes the following -
database_name
schema_name
table_name
description
description_source
business_owner
technical_owner
Thank you for all feedback you made so far and we are always eager to hear more of your thoughts on the features. Have a great day!
-Select Star Team 🫶
March 17, 2023 - Improved Nested Tag Asset Inclusion, Increased API Rate Limit Options and Slack Updates
Hello everyone, I hope that all our Select Star users are having a wonderful week so far. We are pleased to bring you some new updates for this week.
🏷️ Improved Nested Tag Asset Inclusion
If a tag has nested tags, all assets in the nested tags are now included in the parent tag/asset tab. This update should provide a better overview of tag-asset management.
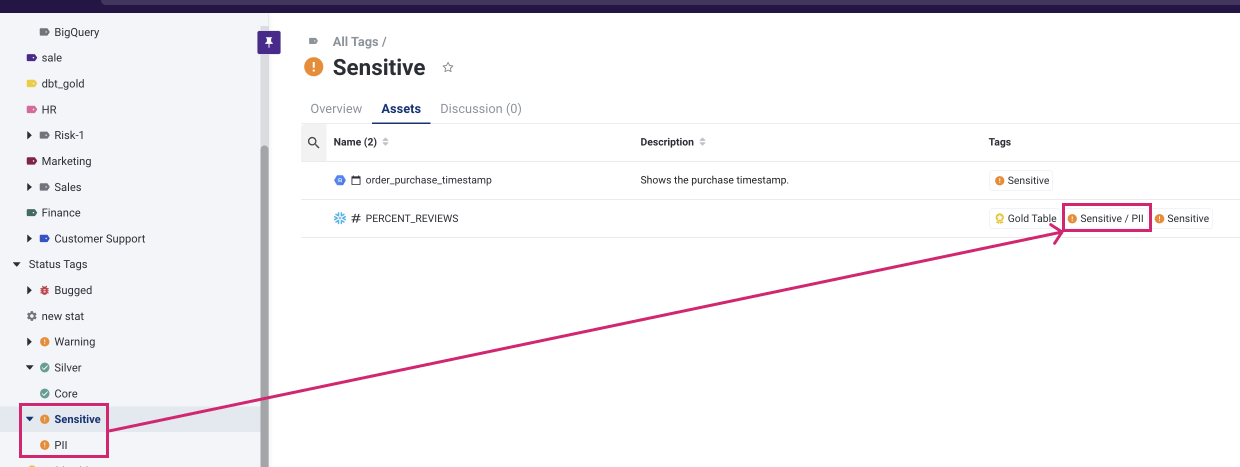
👉 Increased API Rate Limit Options
This week we introduced a new tier for Client API Usage, in addition to our default limit for all organizations of 10K requests per day. This new tier allows for 100k requests per day. For more details, please contact our Sales team.
👉 Slack
We have updated the domain for Select Star's Slack application. Please visit https://slack.selectstar.com/ and click Add to Slack. For more details, see doc.
If you have already added the Slack application, no change is required on your end.
We are one week away from descending in sunny Florida for the Gartner Data and Analytics Summit 2023. Come by our booth (1450) to meet the team, and pick up some exclusive Select Star gear.
March 7, 2023 - New Dashboard Menu in the Sidebar, Nested Tag Support and Metric API Update
🌼Welcome to our first product change log in March.🌼
We're excited to announce several updates that we believe enhance your Select Star experience and also improve the overall performance of the product.
📊 Dashboard Menu
A new addition to our product's user interface - a dedicated "Dashboard" menu section in the left sidebar. Previously, users had to navigate to the "Data" section and then click through a dropdown menu to access specific BI sources. With the new dashboard section, users can now access their BI sources directly.

In addition to these updates, we've also implemented various upgrades to enhance the overall performance of the sidebar.
🏷️ Nested Tag with Full Path
To provide greater clarity on nested tags, we've implemented a feature that displays the parent tags along with their child tags in the UI. For example, if you have two tags, "Sales" and "Metric" tags, it can be overwhelming to track the parent tag for "Metric", in cases when it is nested under multiple tags. Now that we show the parent-child relationship in the UI, you can easily identify where each tag comes from and identify its context within the tagging structure.

This enhancement should make it simpler for you to navigate and manage tags within Select Star.

🏷️ Metric API updates
With the continued commitment to improving our API, this month we updated our Metric API. Now, you can create a new metric with or without adding details to the parameters.
Here is the list of all the Parameters required for POST /v1/metrics/

We have also adding a the option to update the Dimensions using PATCH /v1/metrics/dimensions/
Parameters needed are metric and field.
When updating dimensions, it has be either explorefield, column or tableaufield.
Note: Invalid dimensions objects will result in a 400 error.
For more information, check out our API reference doc.
We hope these updates will enhance your experience and make our product even more useful to you. As always, we welcome your feedback and suggestions for future improvements!
February 22, 2023 - Search Improvements, Team and Tag Mentions and Tag API Update
🔍 Exact vs Fuzzy Search Update
We have invested our time and effort to enhance the precision and quality of our search experience, and we are happy to announce that these efforts have yielded positive results.
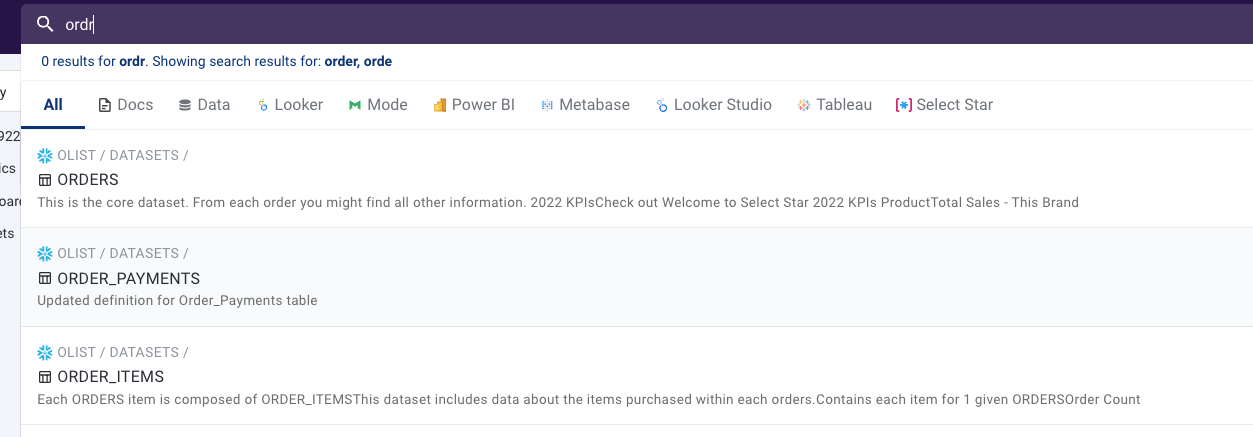
Exact vs. Fuzzy Search Improved Select Star search can help to save time and increase efficiency by reducing the number of results that need to be reviewed.
If you misspell the keyword or if the asset does not exist in the system, we'll let you know that there are 0 results found, and activate fuzzy search with similar keyword search result:
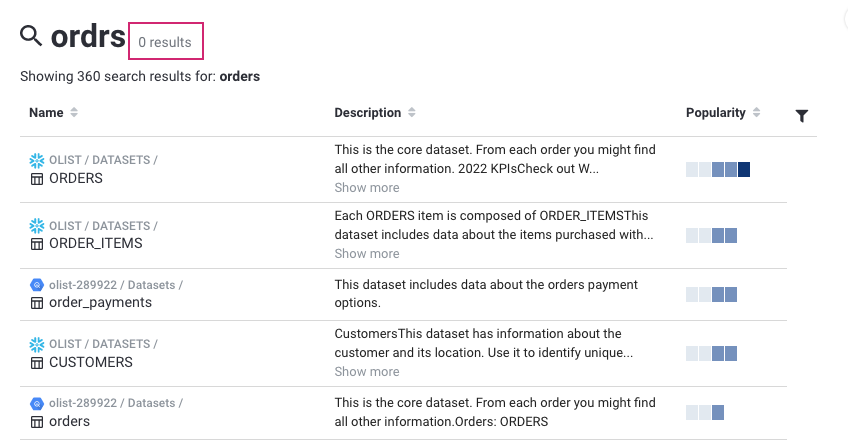
🔍 Full Path Search
As a user, I want to be able to search by full path and find exact table even if the search phrase is very long so that I can open that table page. Our answer: **Yes, you can! **
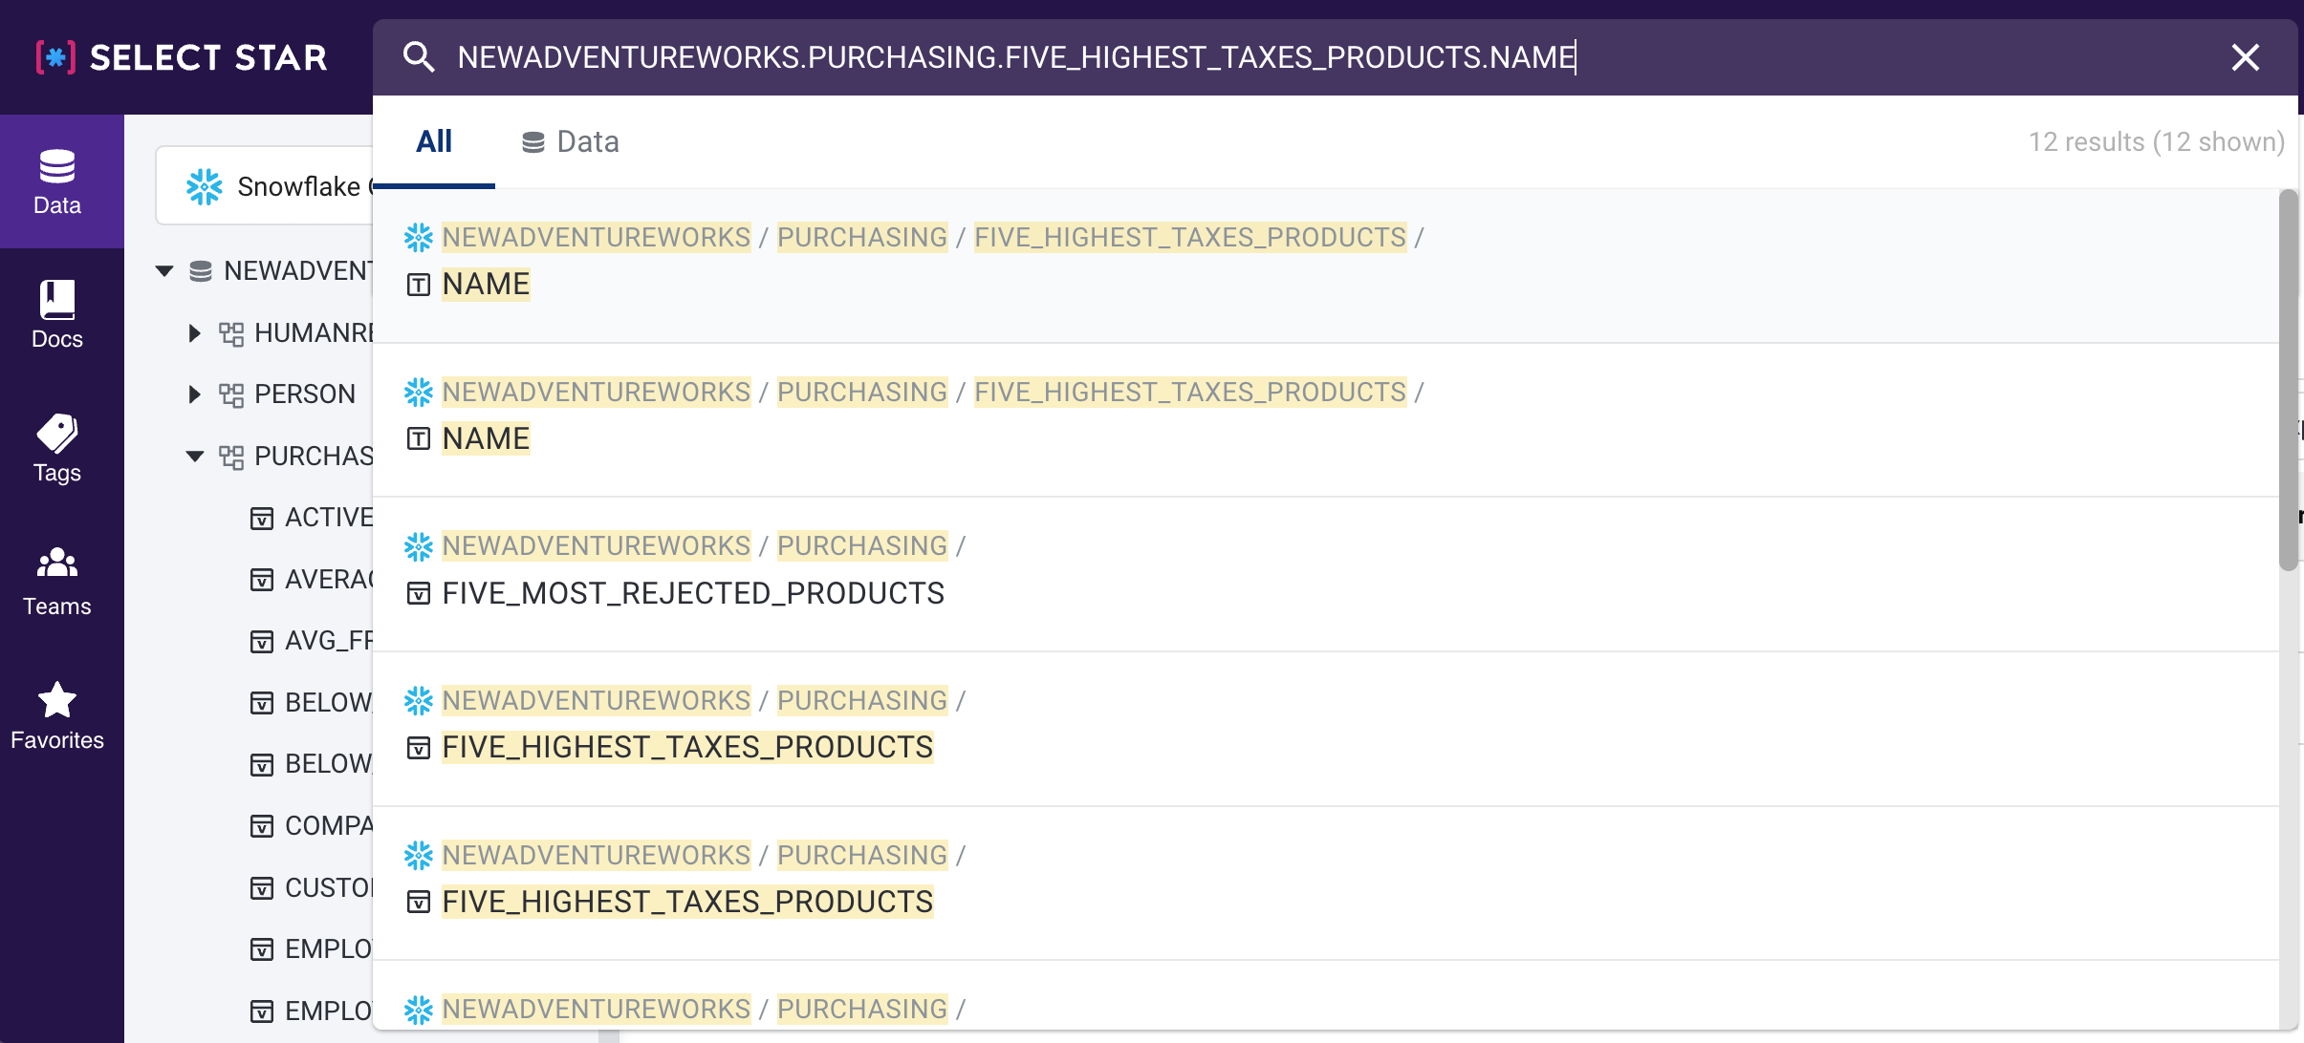
Search results are influenced by various factors, and we are constantly updating our codebase to provide the most relevant results to you.
**🏷️ Team and Tag Mention **
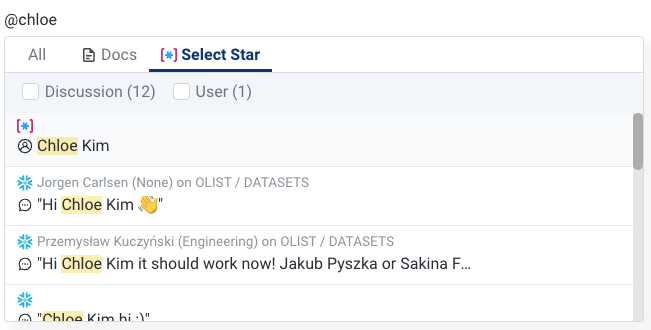
Now in documents or discussions, you can mention other teams or tags you wish to refer.

Clicking on a mention will take you directly to the corresponding page, allowing you to quickly access the information you need, allowing for a smoother workflow between teams.
We have also updated our search to exclude data source users from search results. As a result, you can now easily mention individuals in a doc or description.
🏷️ Tag API Update
We are working on multiple API changes in the coming months, and to simplify API response related to tags, we made the change to our API response to show tagged_items instead of tags.
Example -
For this request, GET https://api.staging.getselectstar.com/v1/columns/?tables={GUID}
Previously, the API response would contain -
{.... "tags": [ { "guid": "tg_M5JGjhULEPsayicYn3j7Vn", "type": "category", "name": "Fernanda tag 5", "icon": "tagPink",......
Now, for the same request the response would contain -
{.... "tagged_items": [ { "tag": { "guid": "tg_M5JGjhULEPsayicYn3j7Vn", "type": "category", "name": "Fernanda tag 5", "icon": "tagPink",
This update changes the response for the following API calls -
columns_list
columns_read
columns_partial_update
tables_list
tables_read
tables_partial_update
Learn more about our API in the doc. For API examples, refer to this doc.
Have a great day everyone!
February 2, 2023 - Field Usage for Lineage (beta), User Analytics and Team page update 🚀
📝 Field Usage for Lineage (beta)
Select Star's new Field Usage feature provides a better understanding of data transformations. It gives you a deeper visibility of how each table / columns were built & transformed.
By pinning a column/field, you can see either on upstream and/or downstream if the field data value is being used As Is, Aggregated, Transformed, or as a Filter.

We hope this feature helps data engineers and analysts do more efficient data pipelines management and troubleshoot issues to maintain high data quality.
Learn more in the doc.
📈 User Analytics
With Select Star's new Analytics feature we provide a platform for the data admins to analyze data on Select Star user activity and data usage. All statistics are based on user activities that are tracked when they perform an action in the Select Star application, and provide valuable insights into user behavior.
Within the Users tab, you will be able to see the information about total views, clicks, and edits per user.
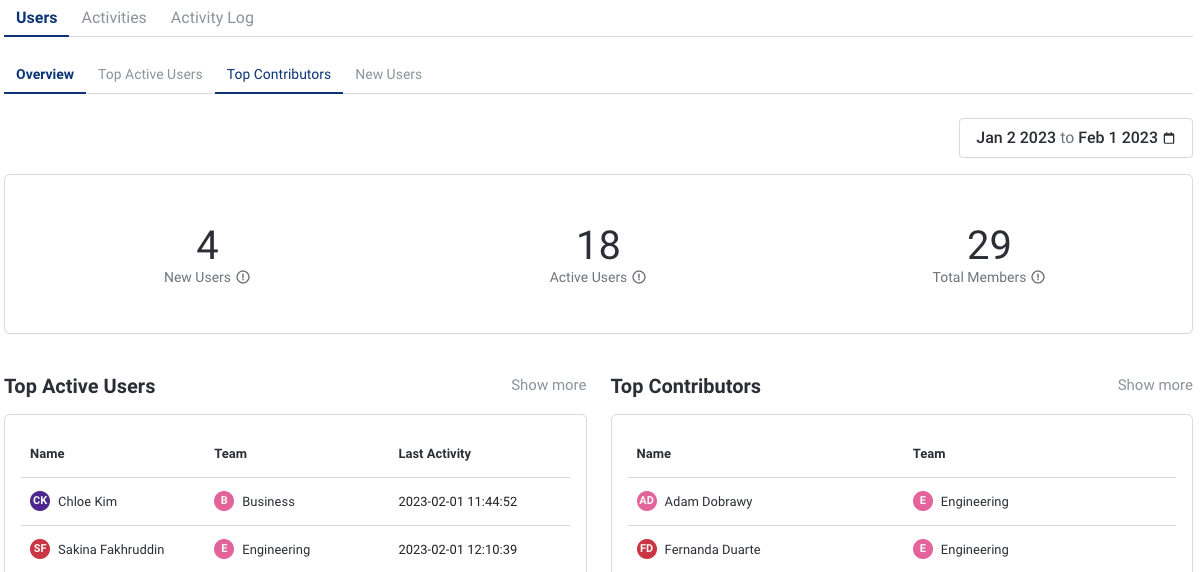
In the Activities tab, you will be able track which data is being consumed most, the types of data being used, and the frequency of search on each data type, etc.
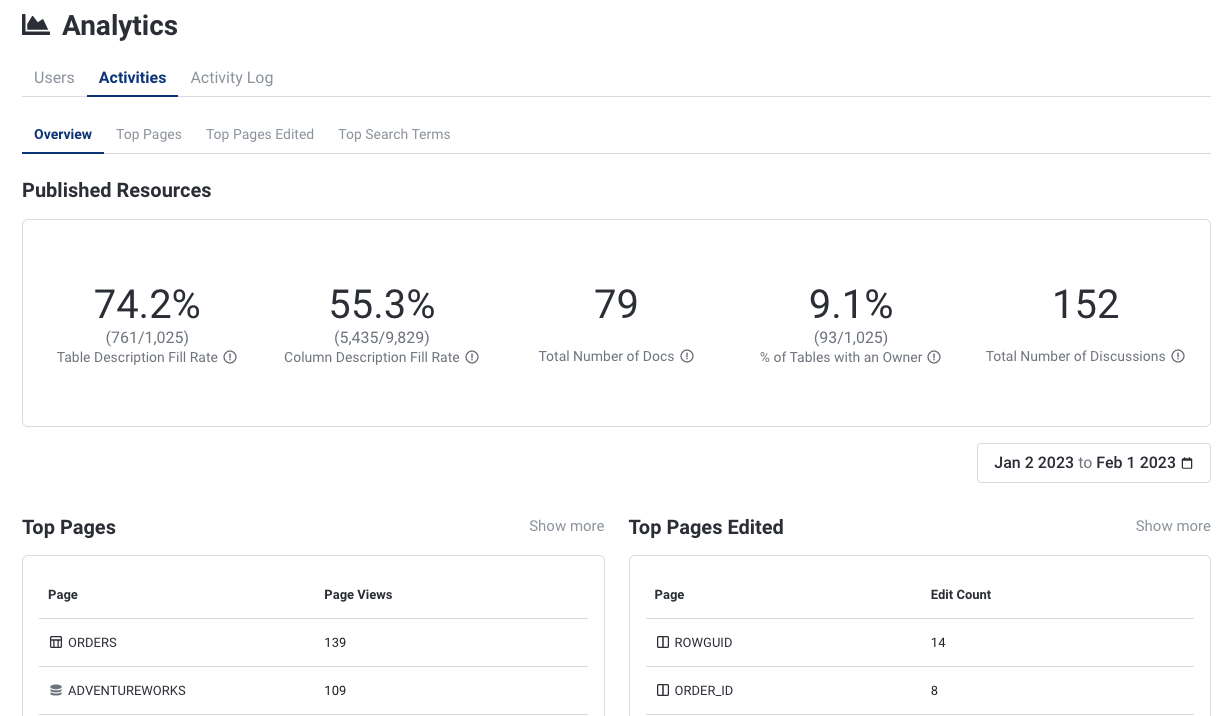
Additionally, you can export the activity log to a CSV file with all log data for a specific date range. 
Learn more in the doc.
🙌 Team page update
We have now added "Team Members" tab on your team page with the team member information including their names, email addresses, and roles. This will help you to easily identify all the team members.
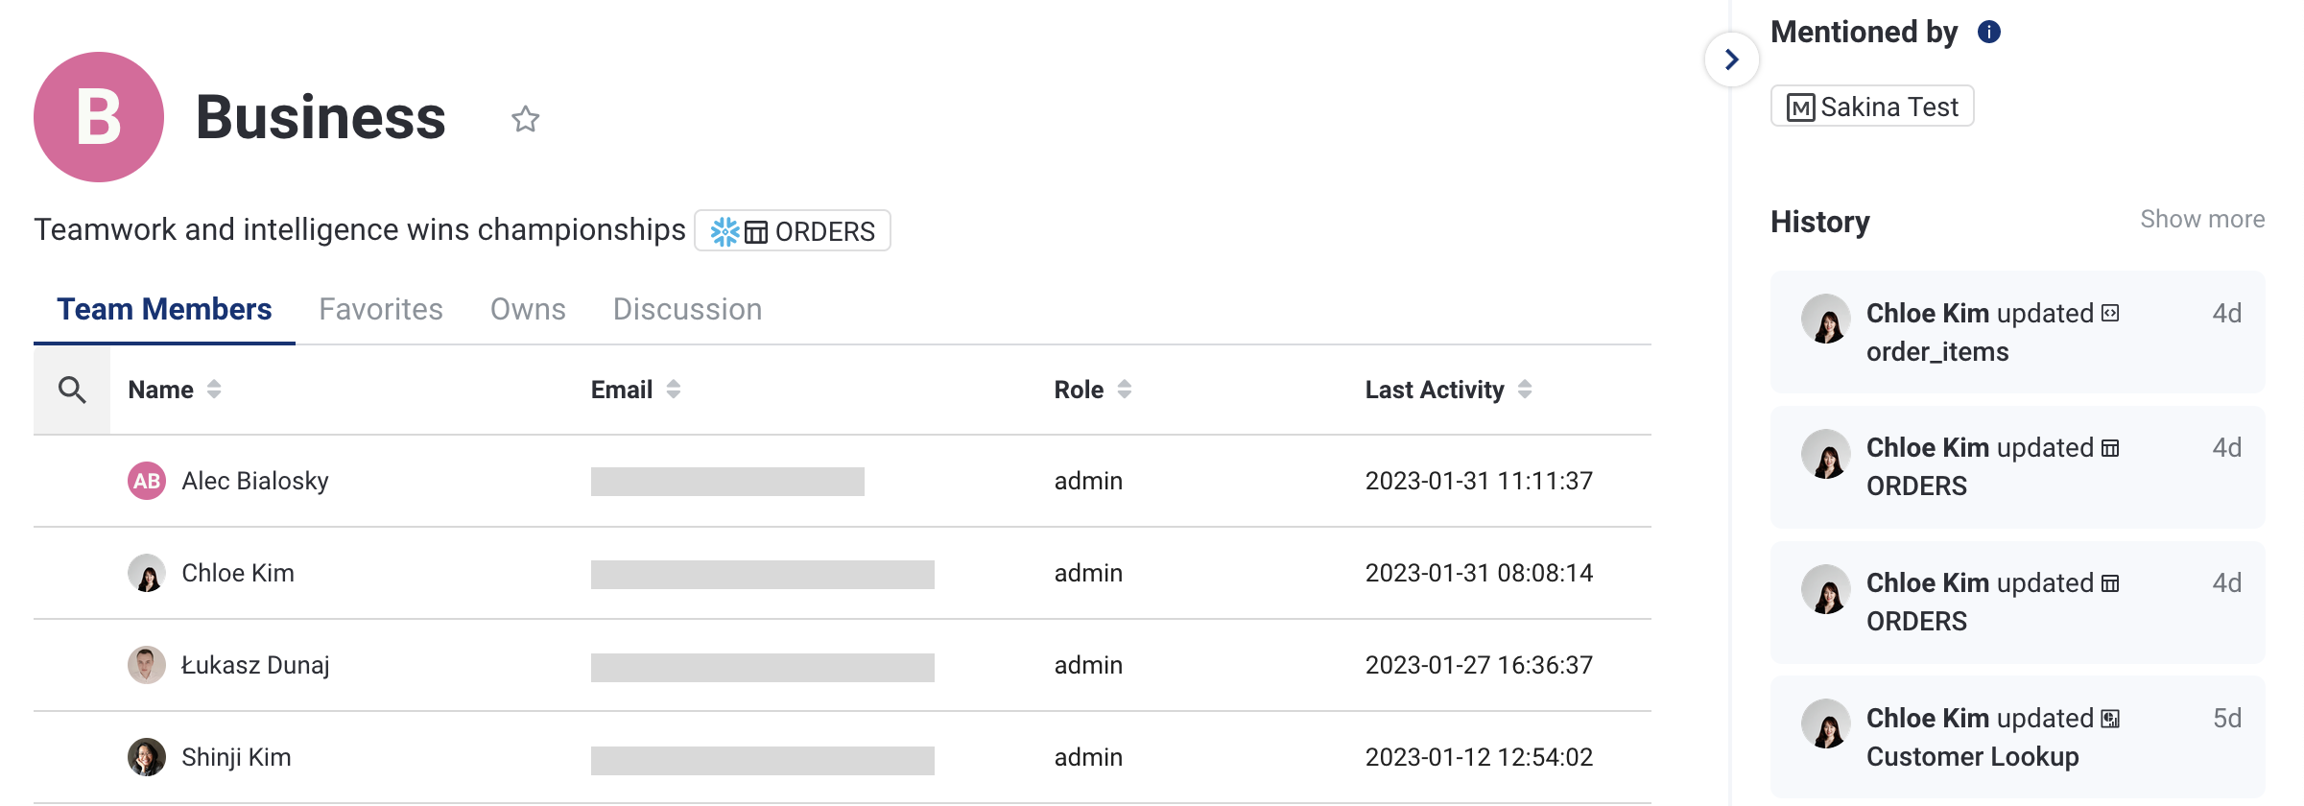
The role refers to a specific function and responsibility in Select Star that is assigned to each team member. To learn about roles visit this page.
Discussion tab provides team members a place collaborate with each other.
Learn more in the doc.
January 24, 2023 - Looker Looks, Views, and Folder Support 💫
One of Select Star's strengths is strong Looker integration. Now, Looker integration will be more robust with support for LookML Views, Looks, and Looker Folder page.
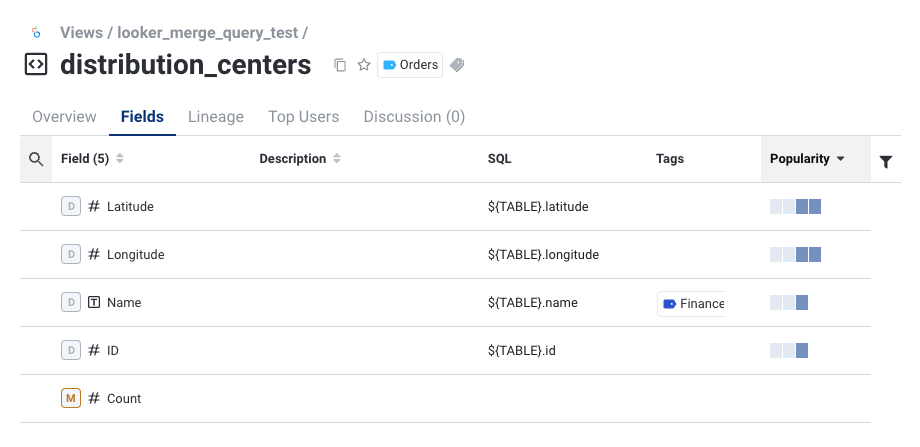
1. LookML View
LookML Views are now fully supported within the Select Star. You can see out both view-level and field-level lineage.
2. Looker Look
With the new Look page, you can see Looker Look-related metadata on the overview page. Also, you can open this Look with the ‘Open in Looker’ button.
 From the left sidebar, you can get a list of Dashboards and Looks as well.

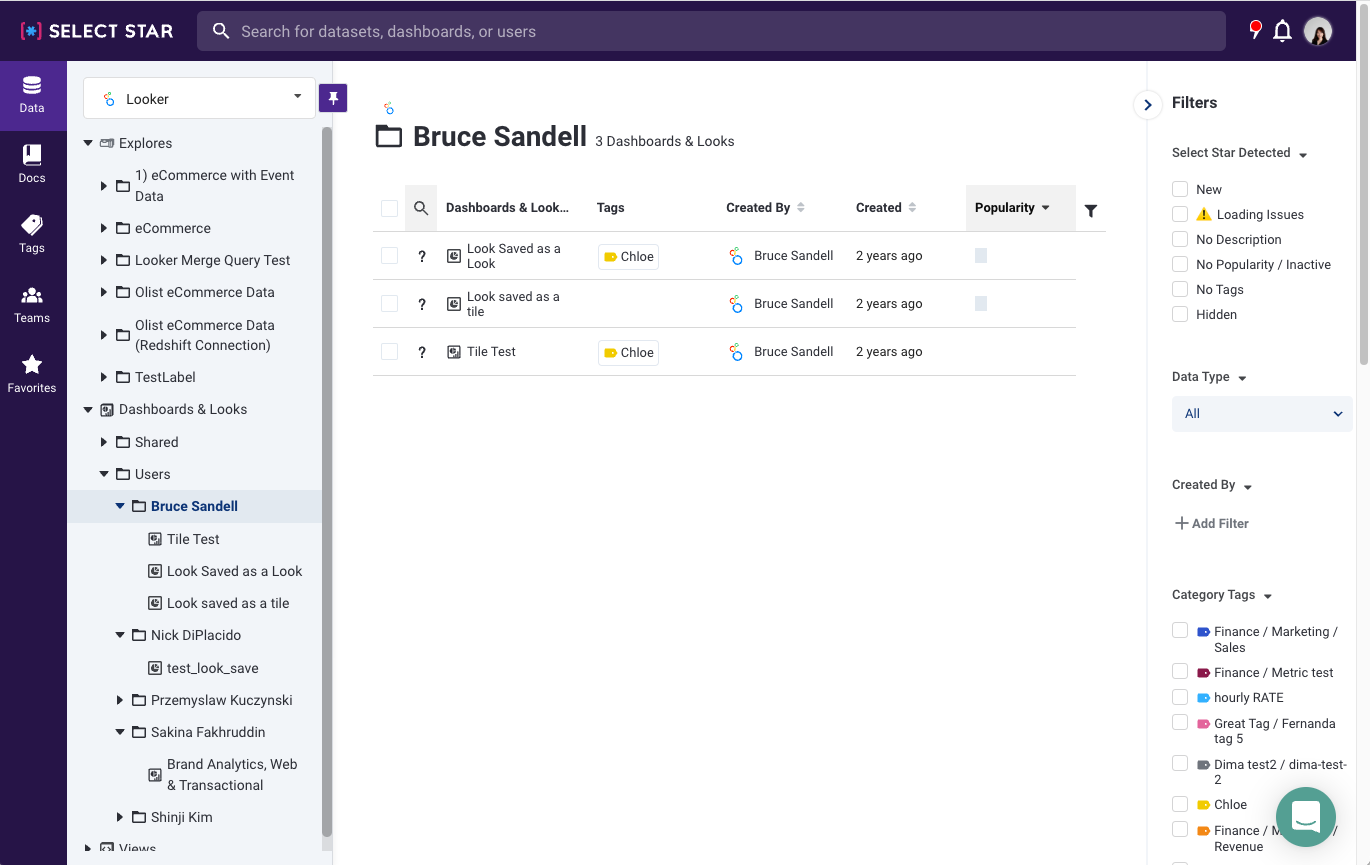
3. Looker Folder Page
You can now see an individual's Looker folder page along with the Shared folder in Select Star. This will help you identify each team member's Looker assets, along with all the shared assets.
Thank you for all feedback you made so far and we are always eager to hear more of your thoughts on the features. Have a great day! -Select Star Team 🫶
January 13, 2023 - Select Star Chrome extension BI support updates, Custom Attribute, Team page, and dbt tag update
Happy New Year Everyone!
We would love to start the new year with the beloved Select Star Chrome extension updates.
1. Chrome extension updates (Tableau, Looker, Mode, PowerBI and Sigma)
Now you can see the relevant information on the Select Star Chrome extension while seeing Tableau, Looker, Mode, Sigma, and PowerBI.
So how can we use it? Simple and easy.
Step 1. Go to the BI tool you use
Step 2. Click and open the Select Star icon from the Chrome toolbar.
Step 3. Select Star information on your dashboard will load automatically!

We plan to add support for Google Data (Looker) Studio and Metabase in the near future.
2. Custom Attribute
You can add custom attributes based on asset type in Select Star. A custom attribute is shown in the details section in overview tabs, as a column in the tables, and in the column-level page. Admins can create/edit/delete a custom attribute in the admin page.
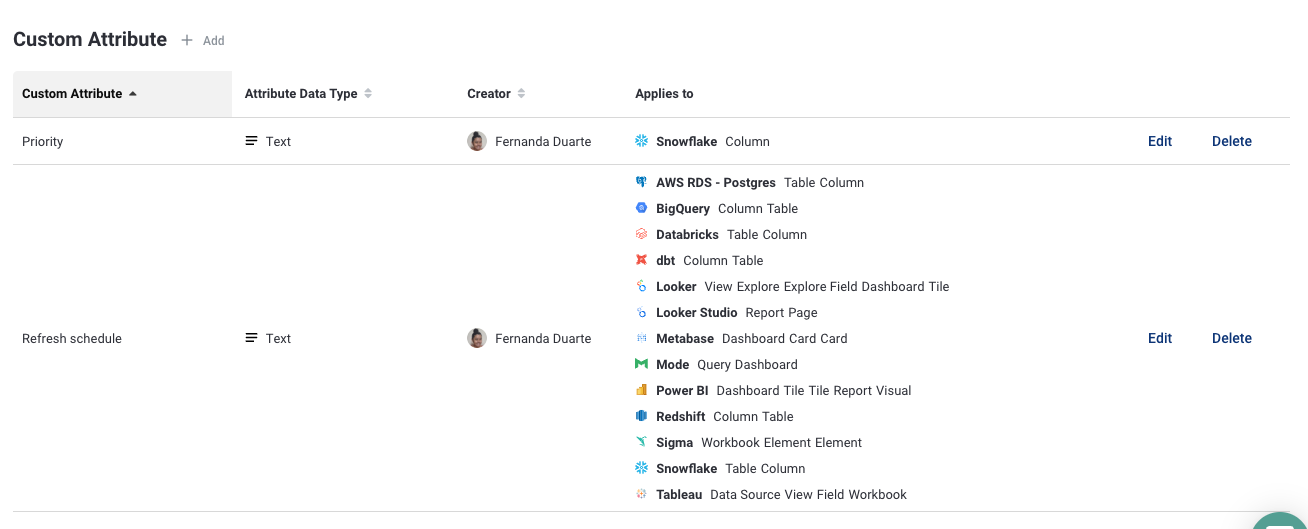
Once create it, you are able to see and manage it in table and column page.

This will allow you to add metadata beyond just title & descriptions, such as table refresh rate, data quality metric, and field name alias. Find more information here.
3. Team page in the Sidebar
The team menu in the sidebar helps team navigation and provides quick access to top-level collections of data/resources in your team and organization. Also, you can add your team's GitHub link, Slack Channel info, etc.

4. dbt tag update
Previously, in order to see the dbt tag, you needed to create a separate data source. With this new dbt tag update, you can see imported dbt tags from your connected dbt source directly on your DWH tables.
If you missed our previous dbt tag update, pls take a look at this past change log and our dbt integration docs.
Have a great weekend everyone!
December 21, 2022 - 🧪 dbt Test Support (beta)
Following the dbt tag support, now you can check all dbt test run results in Select Star!
So how can we see the dbt test results? There are three ways. 😃
1. See all the dbt tests from the Sidebar
If you have a dbt as a separate data source, you'll notice that we added dbt Tests on the sidebar. From this page, you can see a list of all the dbt tests on one page. You are also able to filter the list based on the Failed / Warning / Passed status. Moreover, you can add descriptions and tags.
By Clicking on each dbt test name, you can see its run history, source, and even error message Select Star. This will help you to see all the information related to the specific test:

2. Find the dbt Tests that ran for the model.
We’ve added a Tests tab on the dbt model page. So you can see a specific model-related test results list.

3. Search the specific dbt test name you are looking for.
Just type the test name in the search bar. It will show the result you would like to find.
Tip. Check off the dbt test box will narrow your search result.
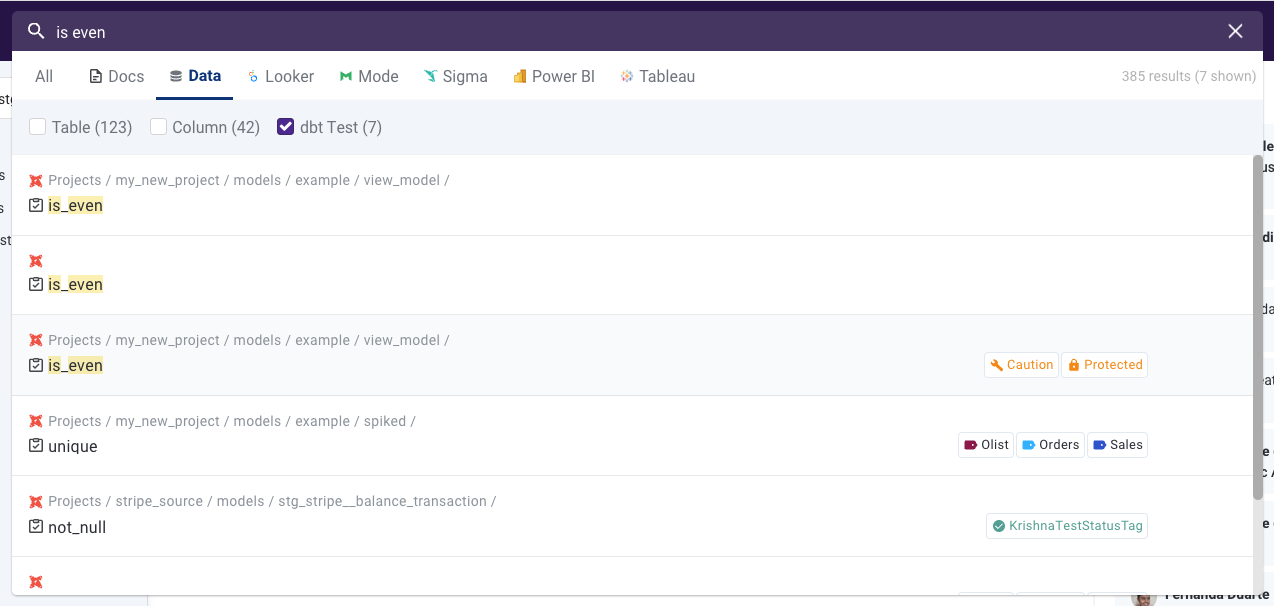
For further information, please check out this document.
Thank you for all feedback you made so far and we are eager to hear more of your thoughts on the features. Happy Holidays!
November 30, 2022 - ✨ dbt Tags, Databricks integration, and Docs update!
🏷 dbt Tags
Now you can import or sync dbt tag with the existent Select Star tags.
If you want to import dbt tag, please refer to [this doc.]((https://docs.selectstar.com/integrations/dbt)
Where can I see the dbt tags setting?
By checking off on tag sync box, you can bring dbt tag to the Select Star. If you want to sync the certain dbt tag with the existent Select Star tag, don't forget to pick the one you want from the dropdown field.

Once you have synced dbt tags within the Select Star, you can see the separate section for it.
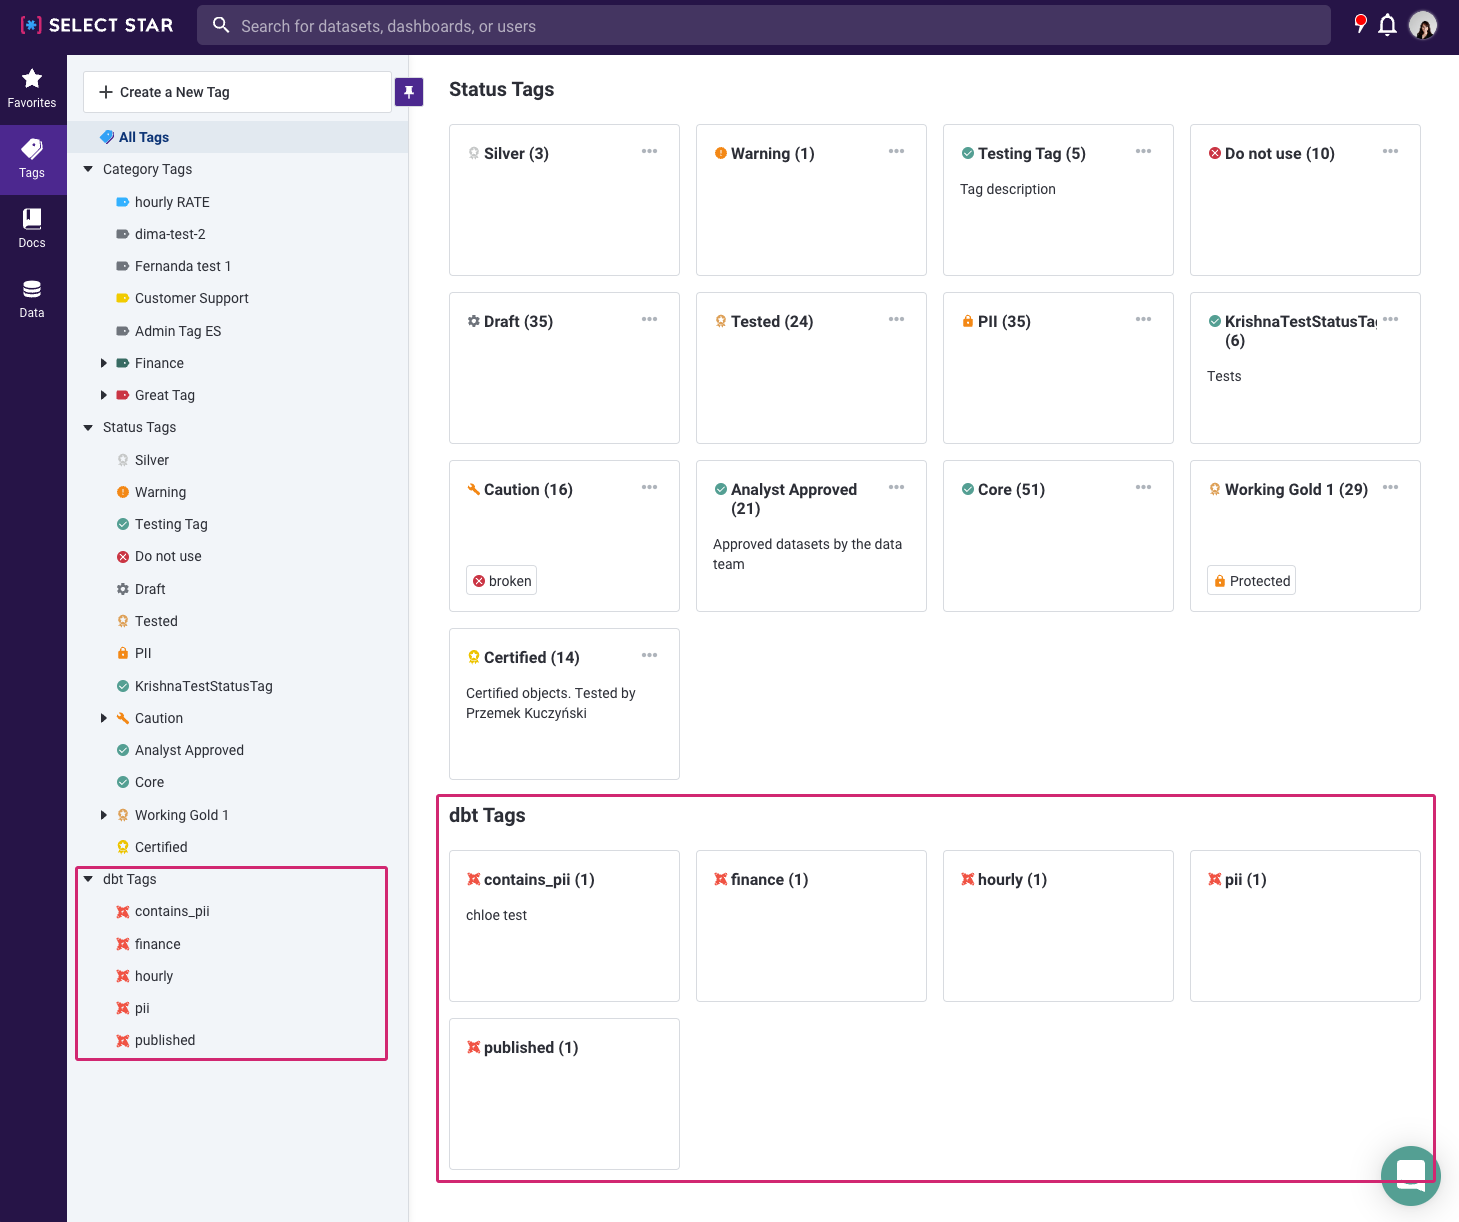
In each dbt tag page, you can see which data assets are tagged.

➕ Databricks Integration
We are thrilled to announce our latest integration - Databricks!
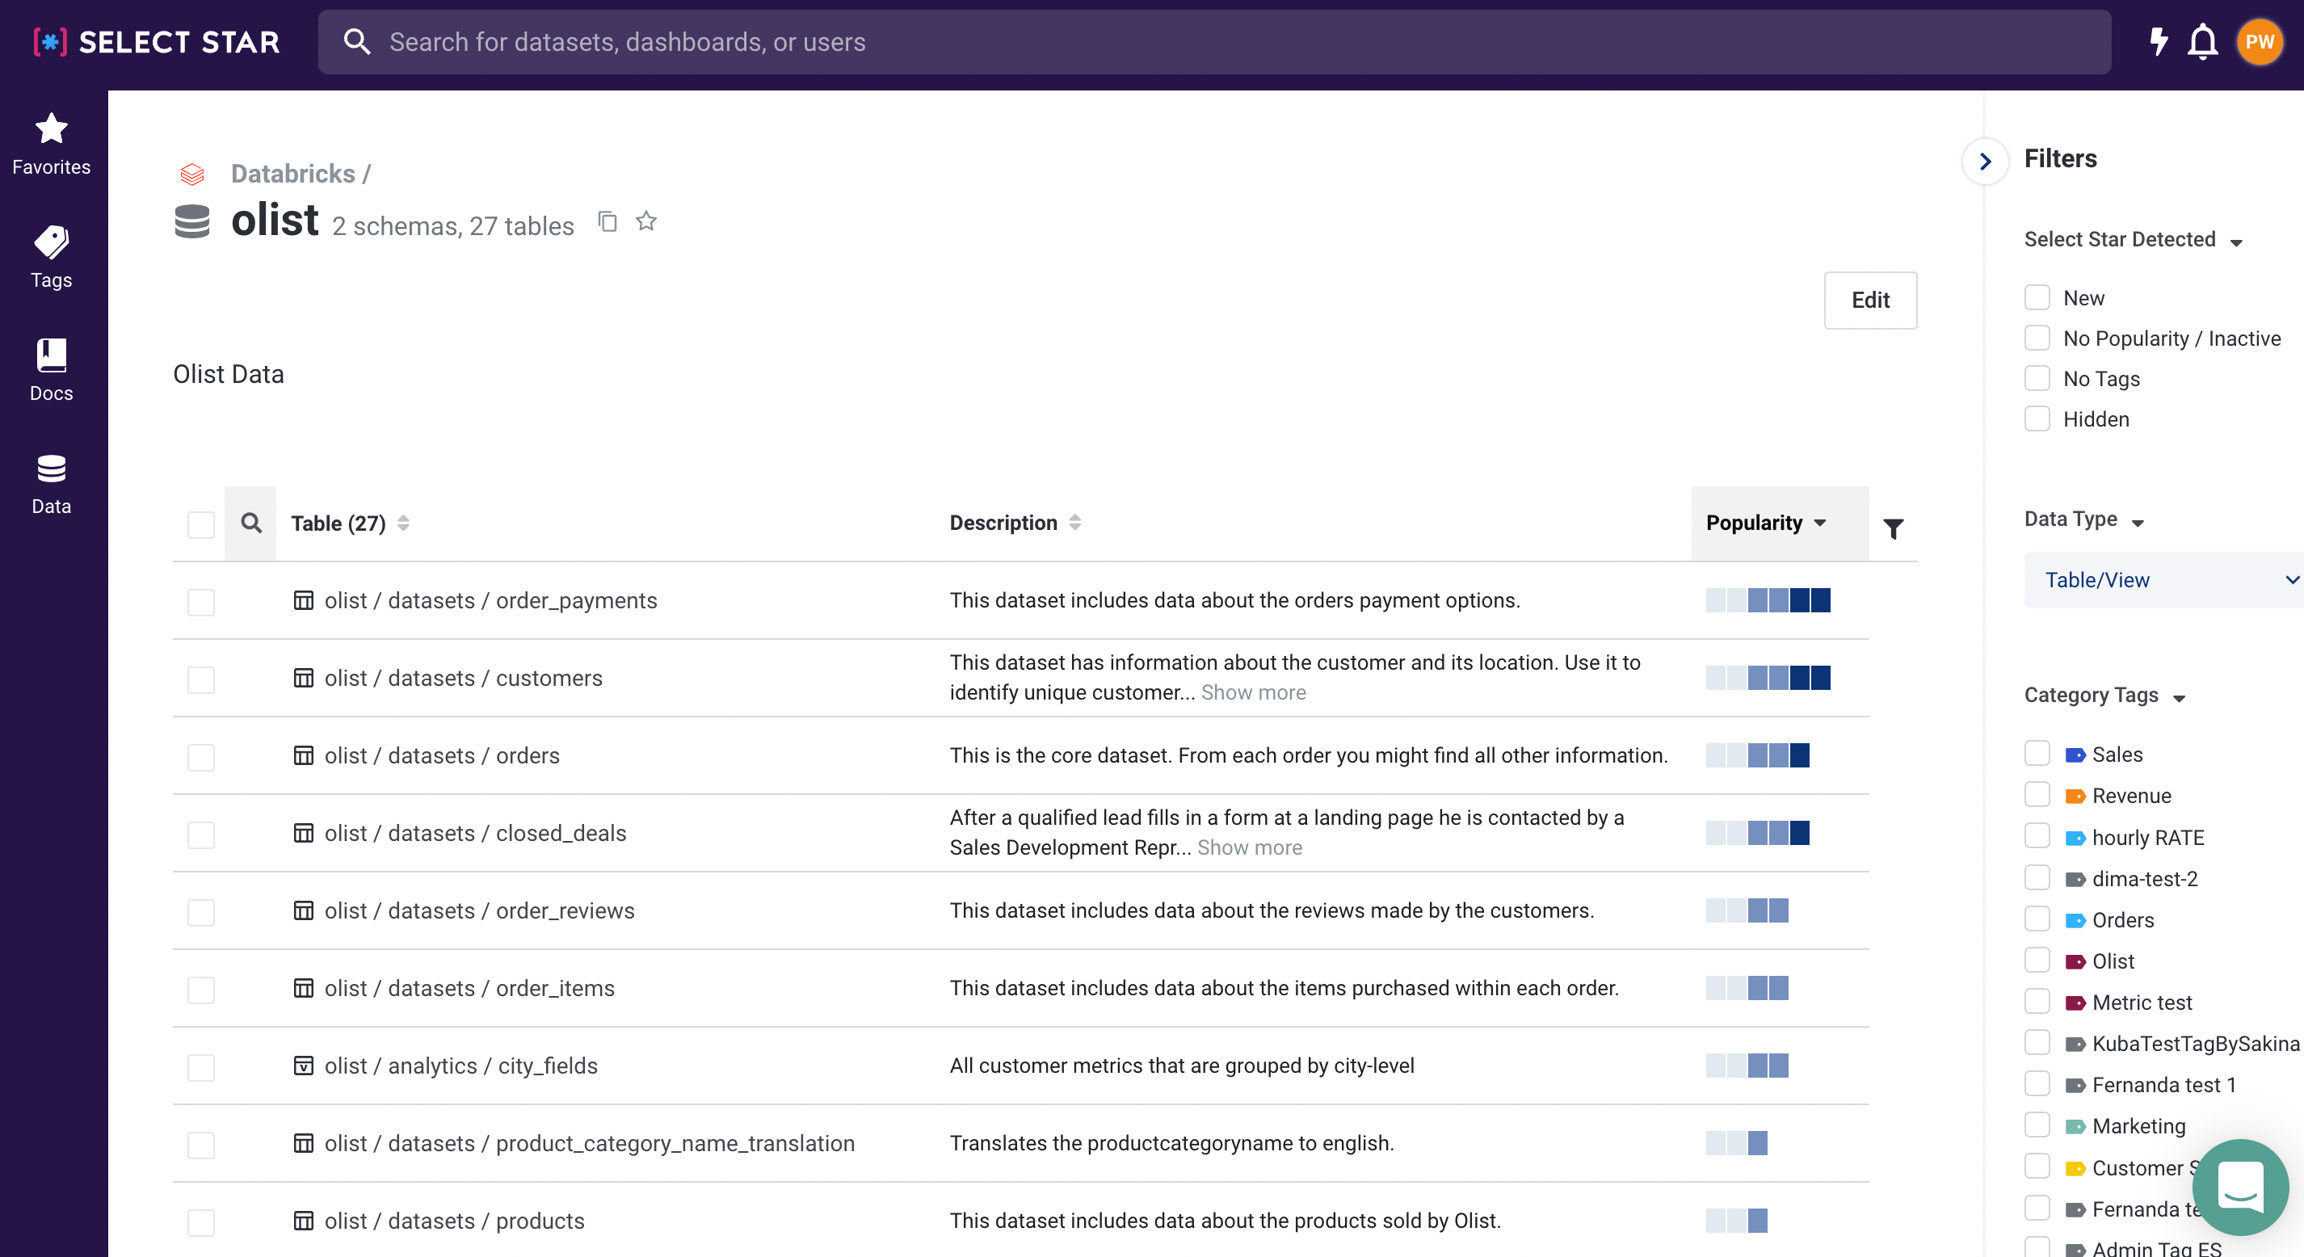
Users with Admin access can follow these instructions and connect to their Databricks instance to their Select Star instance.
Once connected, you will be able to explore data lineage across your Databricks instance and your BI tools.
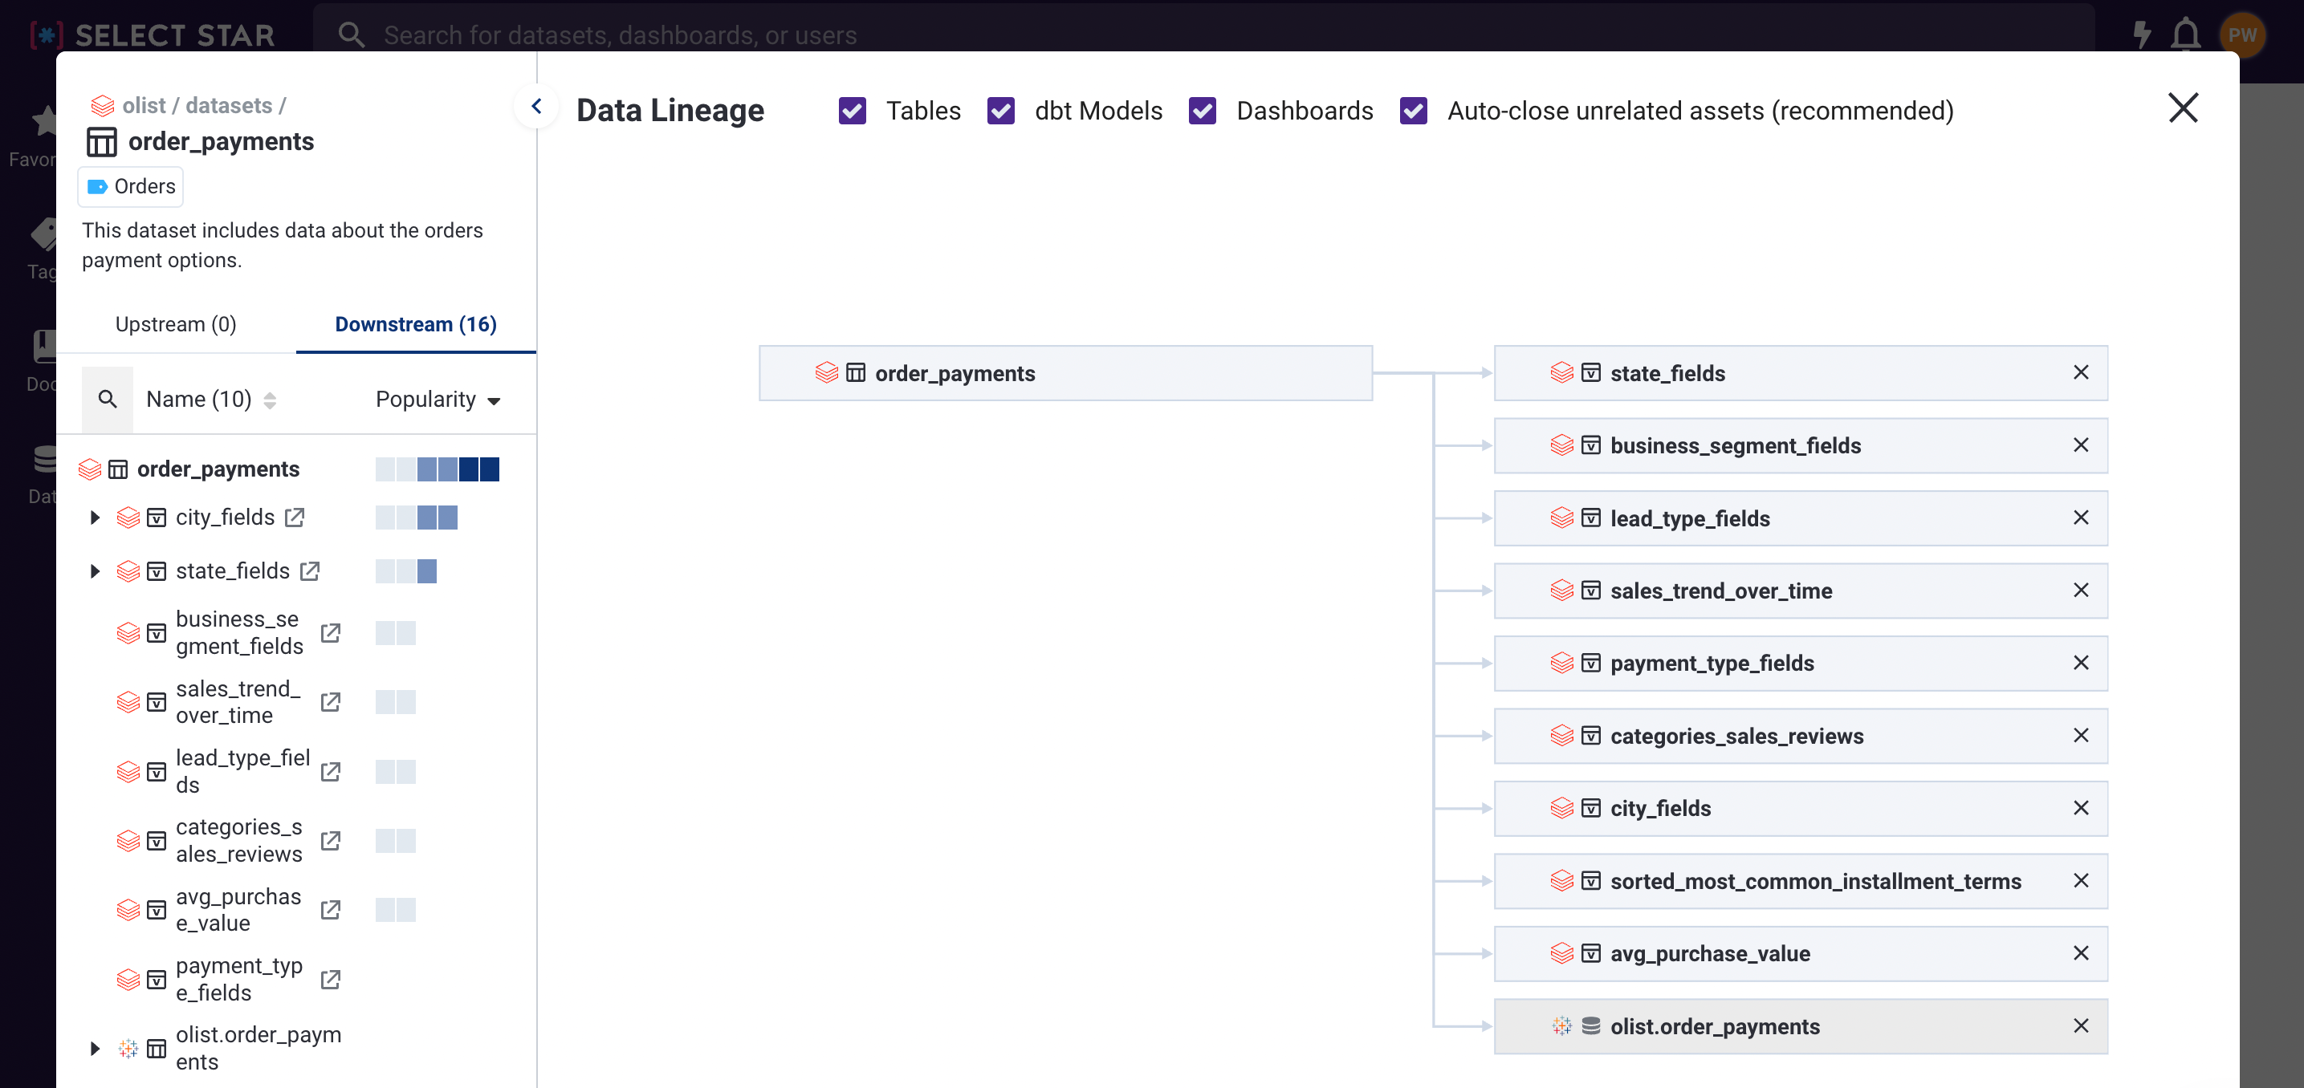
You can also search for tables and columns based on popularity, and much more!
✍️ Docs Update
Creating a new document and metrics can be made directly from the sidebar.
Also, you are able to see the specific set of document with one click from the tab.

Also, you are able to see the specific set of document with one click from the tab.
🔎 Usage Column
Great news for Looker users! Now we show how each looker field is used as As Is, Transformed, Aggregated, or Filter in the Column Lineage page.
As Is - Column has been replicated as is Aggregated - Column data is aggregated under SUM(), COUNT(), etc. Transformed - Column data has been transformed but not aggregated Filter - Column has been used as a filter for a dashboard or explorer
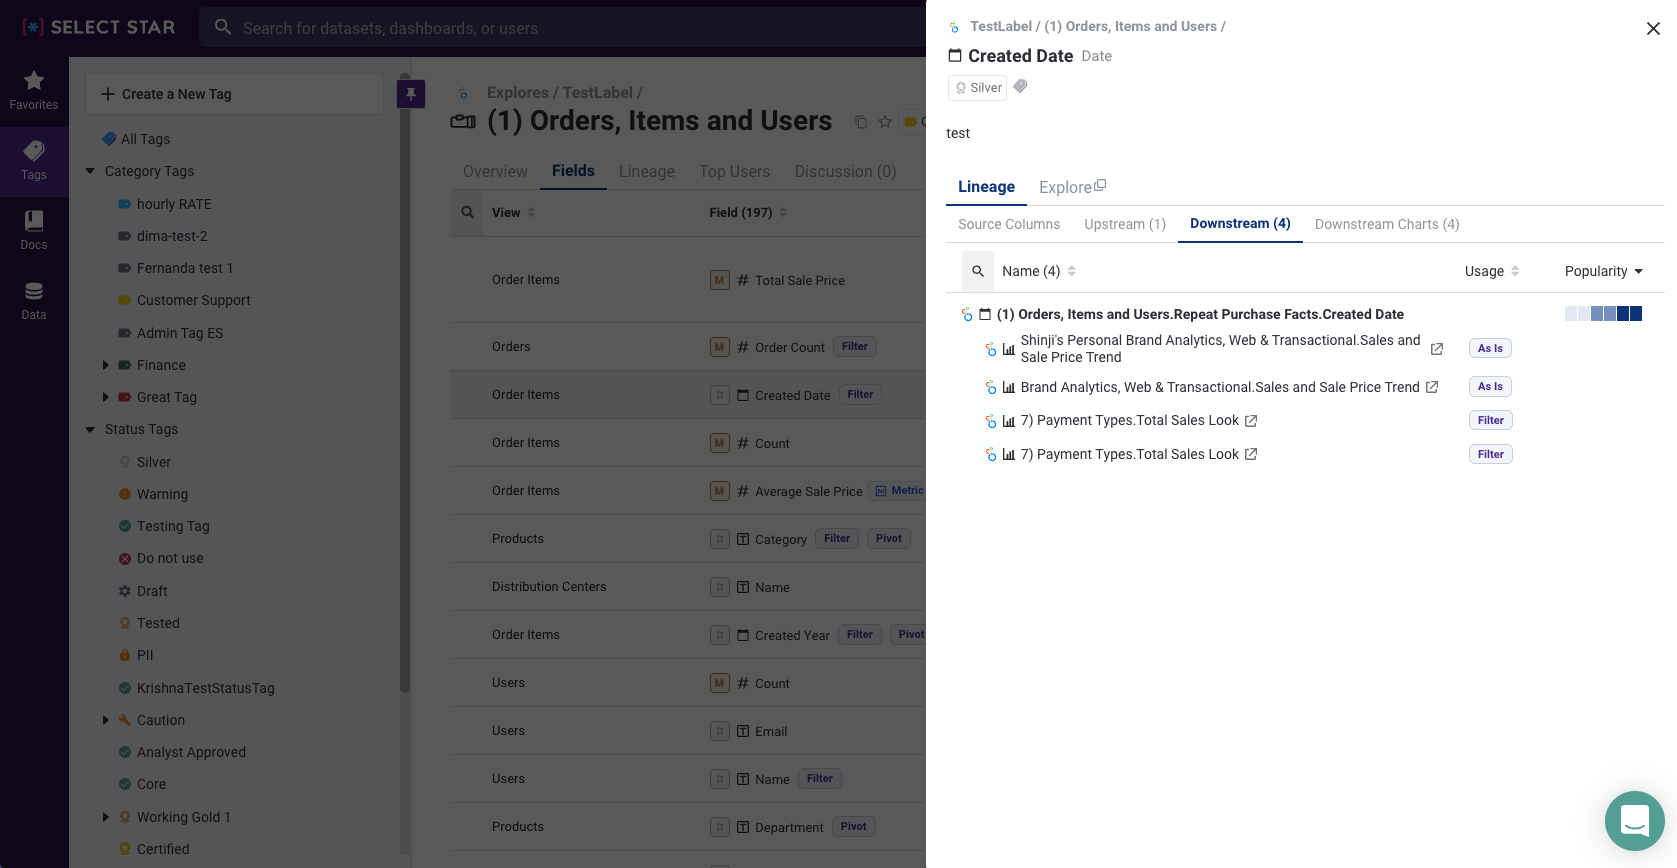
We hope you have a great day! and will bring more news in December. Stay tuned!
November 4, 2022 - 👥 Policy-based Access Control(Beta), SQL on Lineage Explore
👥 Policy-Based Access Control (Beta)
We are gradually rolling out our new Access Control starting today. This new feature involves setting different view permissions and privileges within Select Star. Instead of having everyone the same view of Select Star, now you can define which individuals & teams can see which schemas or dashboards within Select Star.
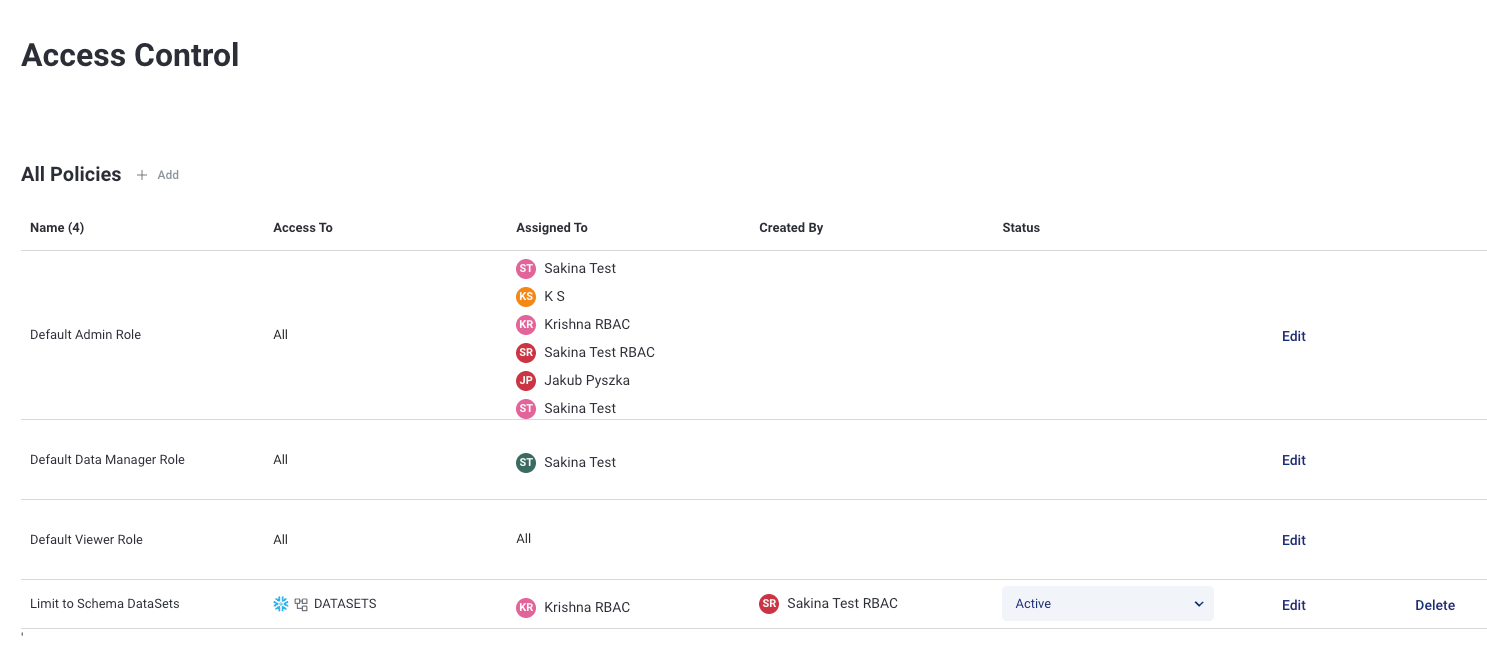
With this control, each organization can have a set of permissions of create, edit, configure, delete, and view-only depending on the roles. Check out our user documentation here.
📝 The new Access Control feature is available for Enterprise tier customers today. If you are interested in trying out our Access Control beta, please let us know.
🔍 SQL on Lineage Explore
Now you can see SQL in the lineage explore level on the spot.

**How can I see this? ** Step 1. Open a Lineage Explore. Step 2. Click on the table name Step 3. Click on the SQL icon
Tip 1. You also can copy the SQL by hovering it .

Tip 2. If the table has no related SQL, you will not able to see that button.
So far so good? Let us know what you think of the new updates!
Hope you have a great rest of the week!🍁
-Select Star Team.
October 21, 2022 - 📍 Select Star Chrome Plugin, Upstream table, downstream charts, and PII Masking
⭐ Select Star Chrome Plugin ⭐
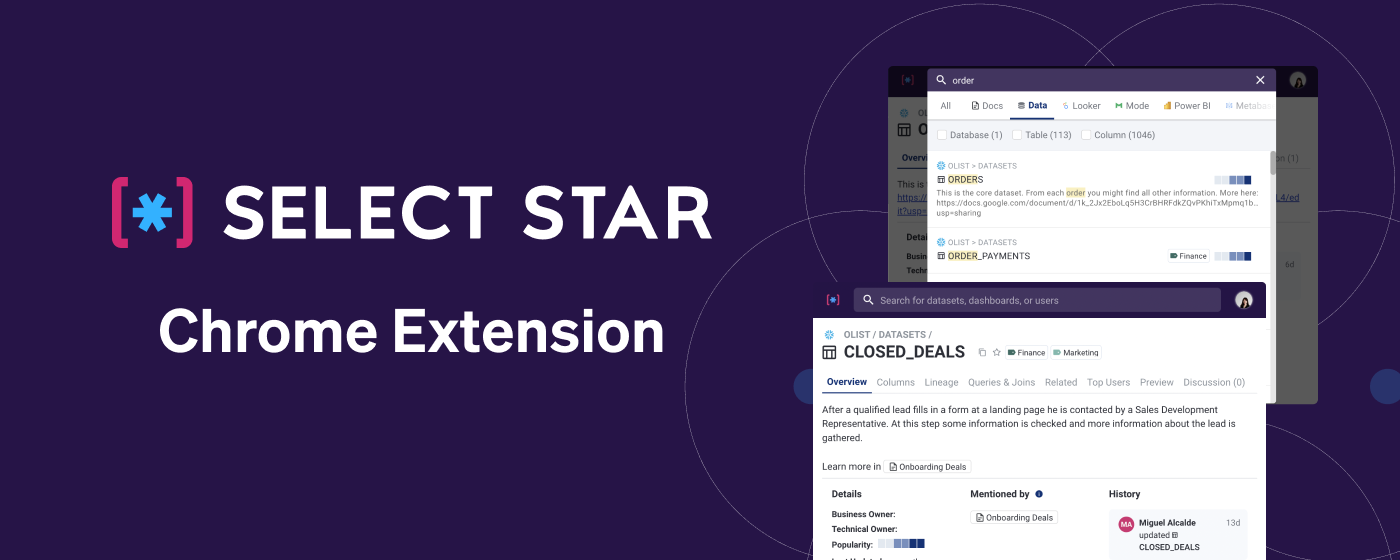
We are excited to announce the launch of the Select Star Chrome Extension! Our Chrome Extension provides a familiar web interface with the added benefit of one-click search.
What’s included? 👀 The Select Star chrome plugin includes everything available in Select Star except for our sidebar, favorite, and settings which will be added.
Search
View table, dashboards related information
Doc/Metrics
Tagging
One click search

How to install it? Download here
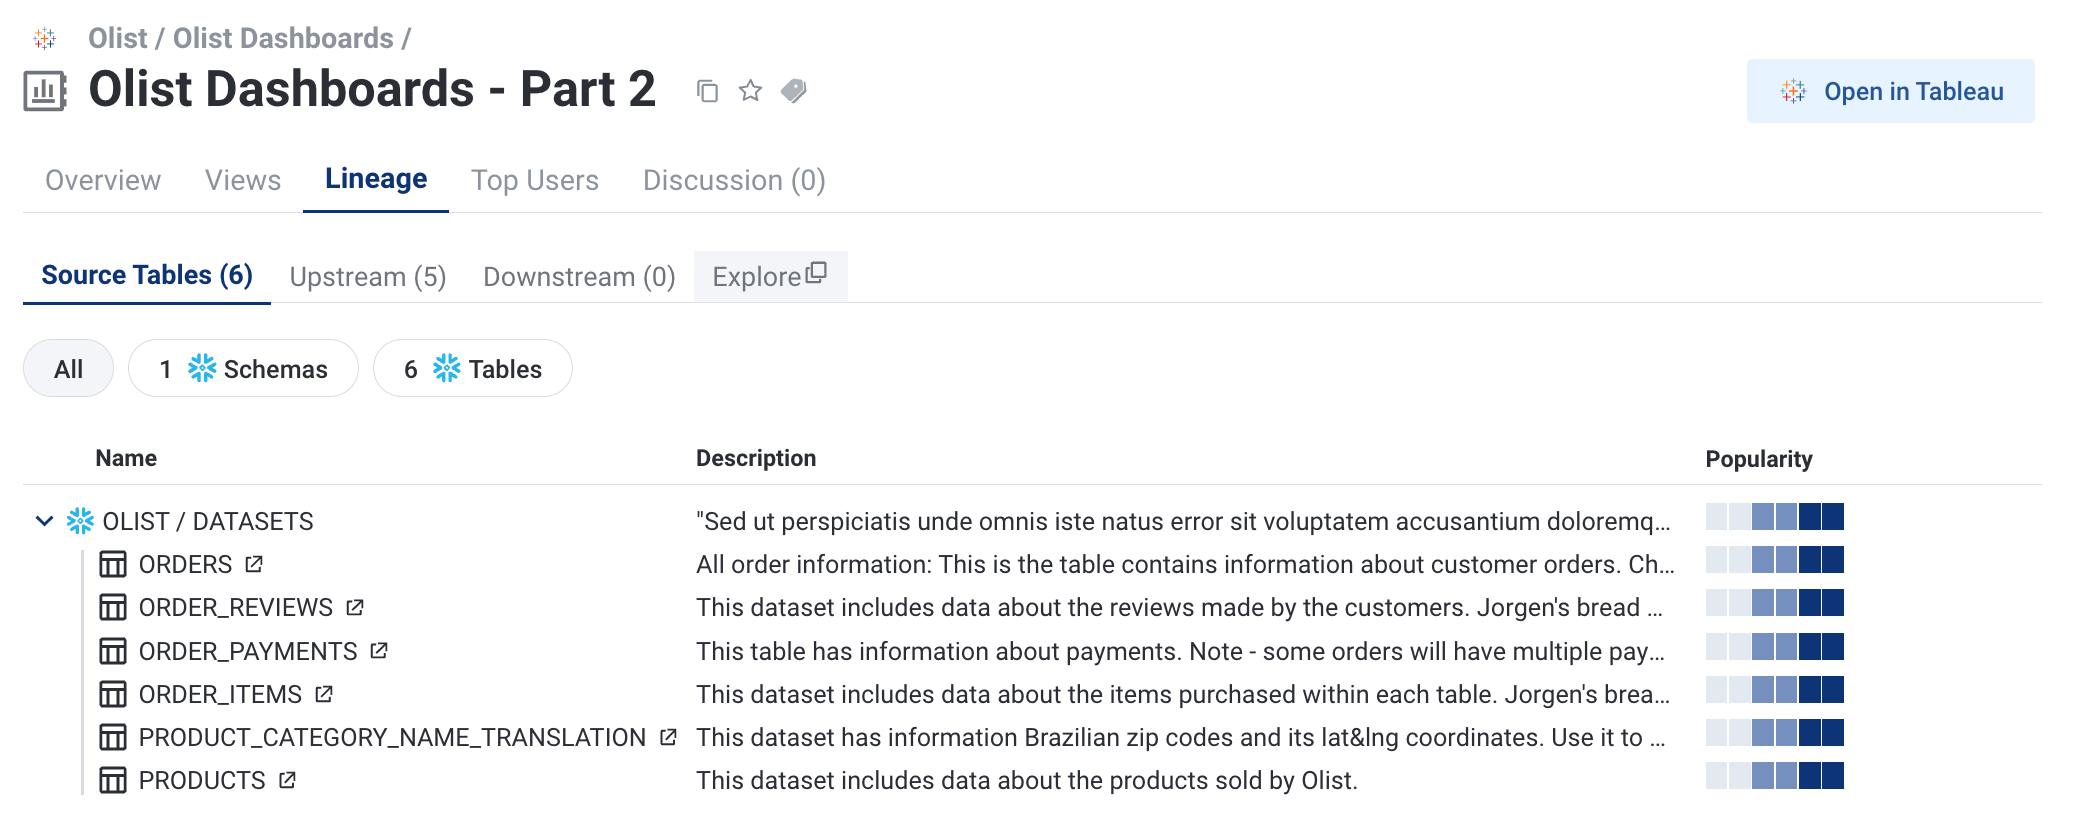
✨ Source tables and Downstream charts.
We created this feature to save you the trouble of finding the downstream charts and upstream tables. a.k.a. Source tables.
For the Source tables,
Go to the dashboard/chart page
Go to the lineage tab
Click the ** Source tables** tab. Now you can see the upstream tables by schema and table level.
For the downstream charts,
Go to the table page
Go to the column page
By clicking on the Downstream charts tab, you can see which dashboard this column was used for.

🔒 PII Masking
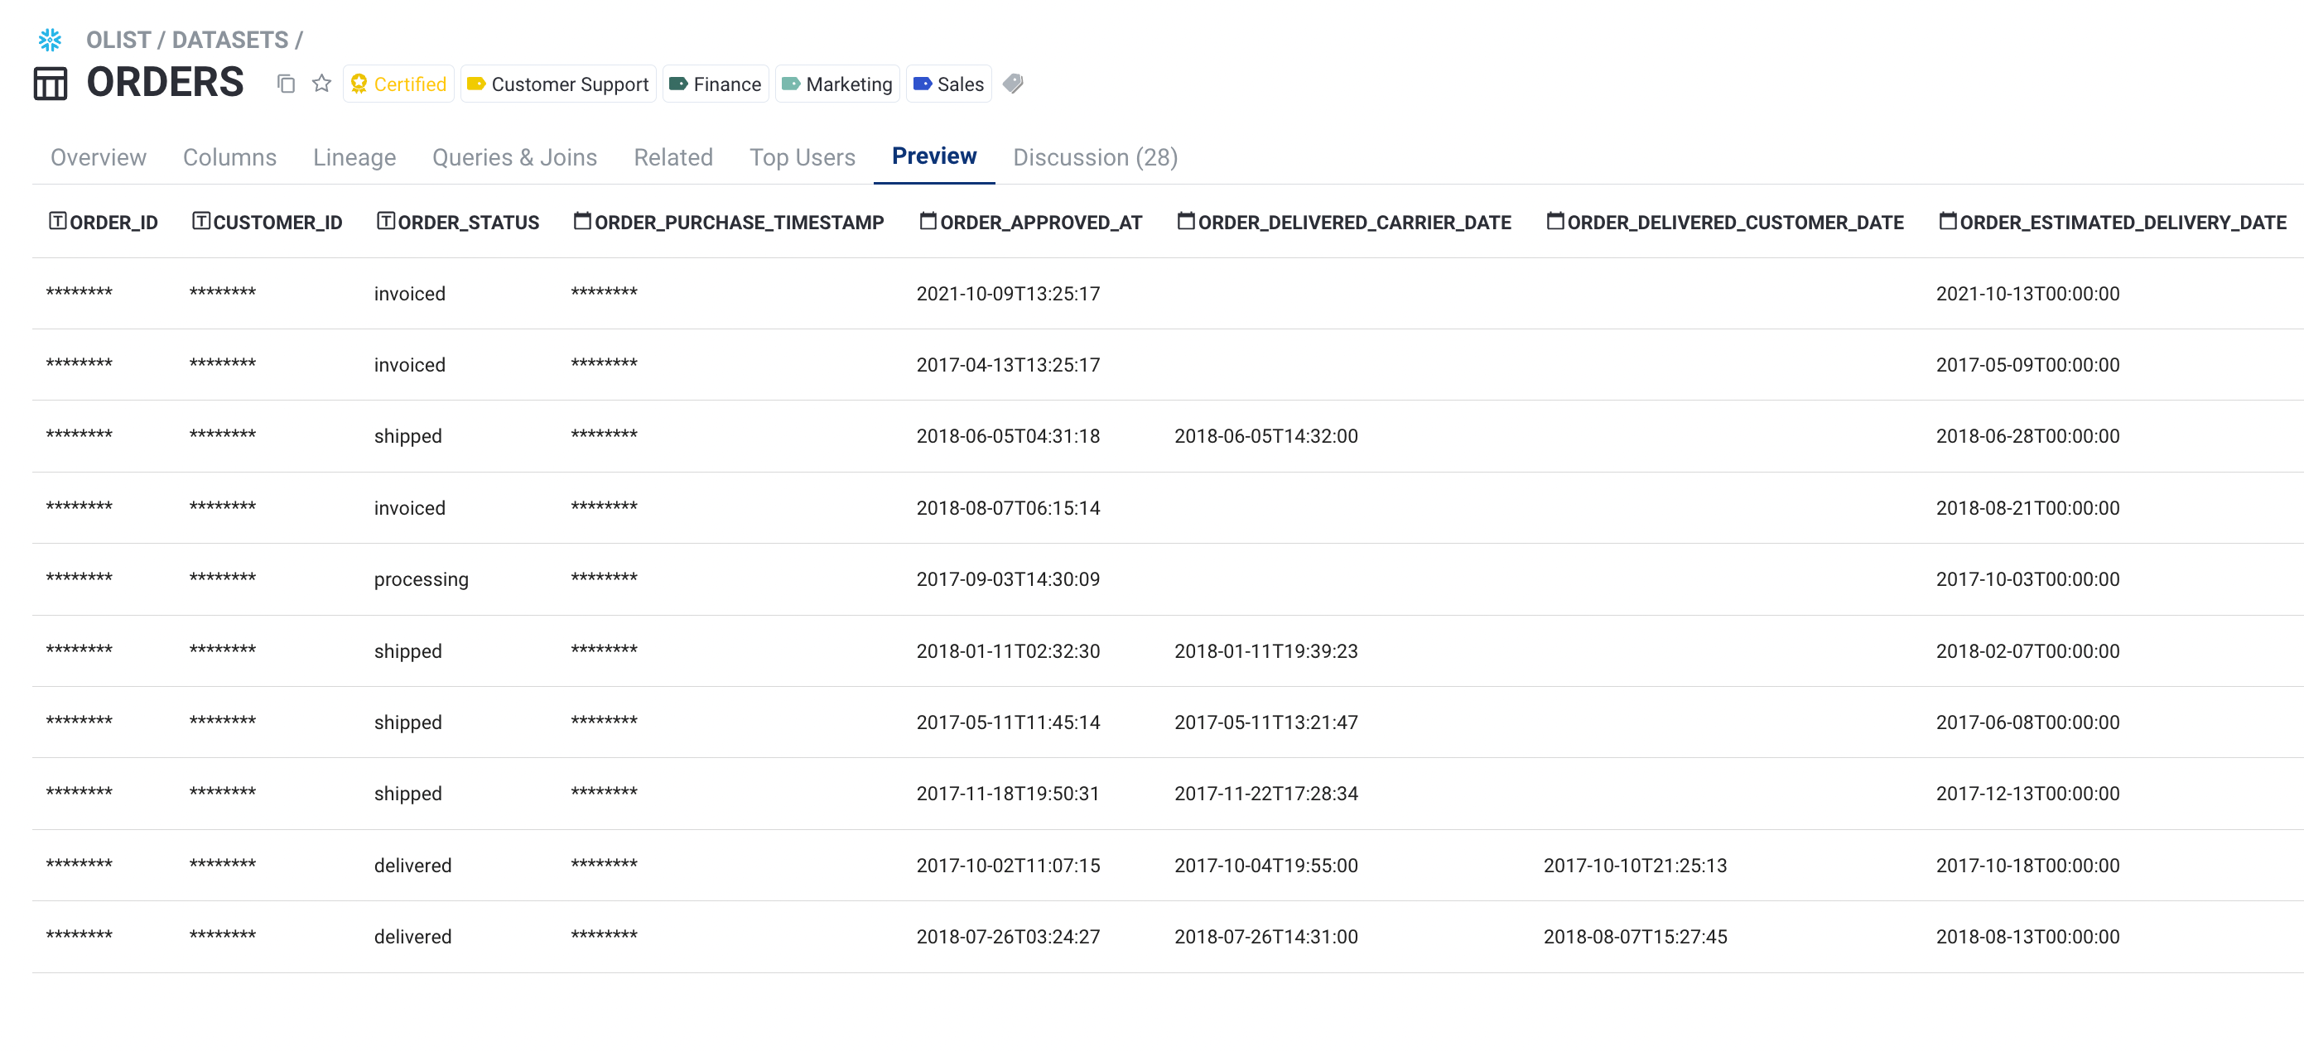
To protect personal sensitive data, if a column has a PII tag, all it's values in Previews tab are now marked as ******** automatically. To use this function, don't forget to tag the table/column you want as 'PII'
🍁 Thank you for all feedback you made so far and we eager to hear more your thoughts on the features. Have a good day! 🍁
September 16, 2022 - 📍Suggested Description Source, Downstream Chart & Upstream Tables, Open Looker Button
📊 Source Tables & Downstream Charts
To understand which tables the dashboard is coming from, you might have to click through the multiple levels of BI data model today. We're introducing Source Tables to be able to give you a summary of all direct tables today.
Source Tables - first level of upstream tables of the dashboard:

Similarly, we are also introducing Downstream Charts similar to Downstream Dashboards tab under lineage.
Downstream Charts - list of downstream dashboards & charts per column:

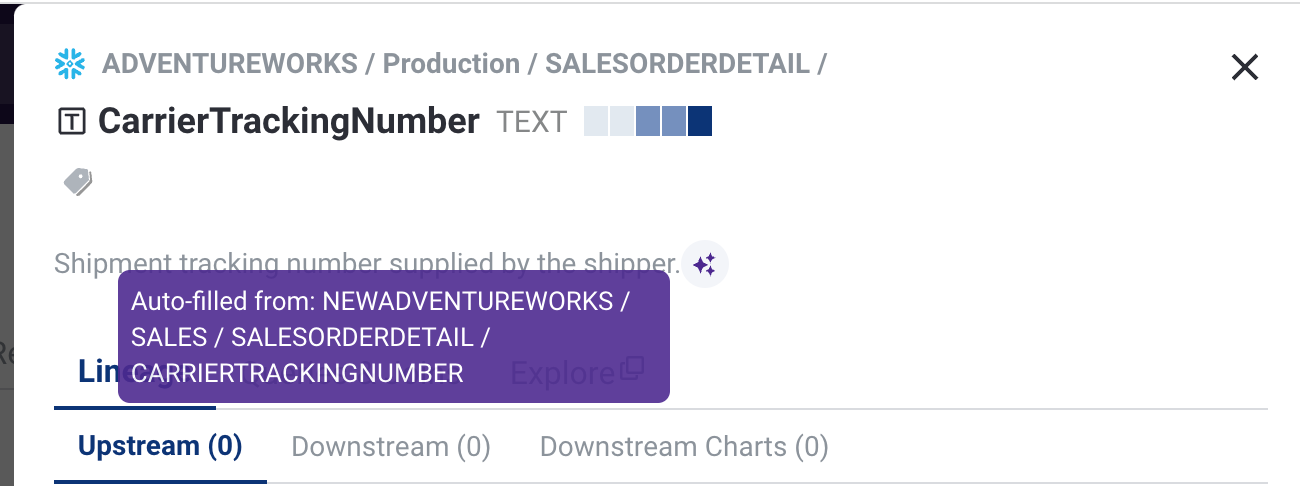
✨ Suggested Description Source
The auto-propagated description is one of our most-loved features. To give more context to it, we start to show where it comes from with the✨ icon.

🏷 Suggested Tags
Select Star will automatically tag asset types with relevant tags from upstream and downstream fields where data is directly propagated.
Select Star will also mark PII tags if the table includes any PII tagged columns.
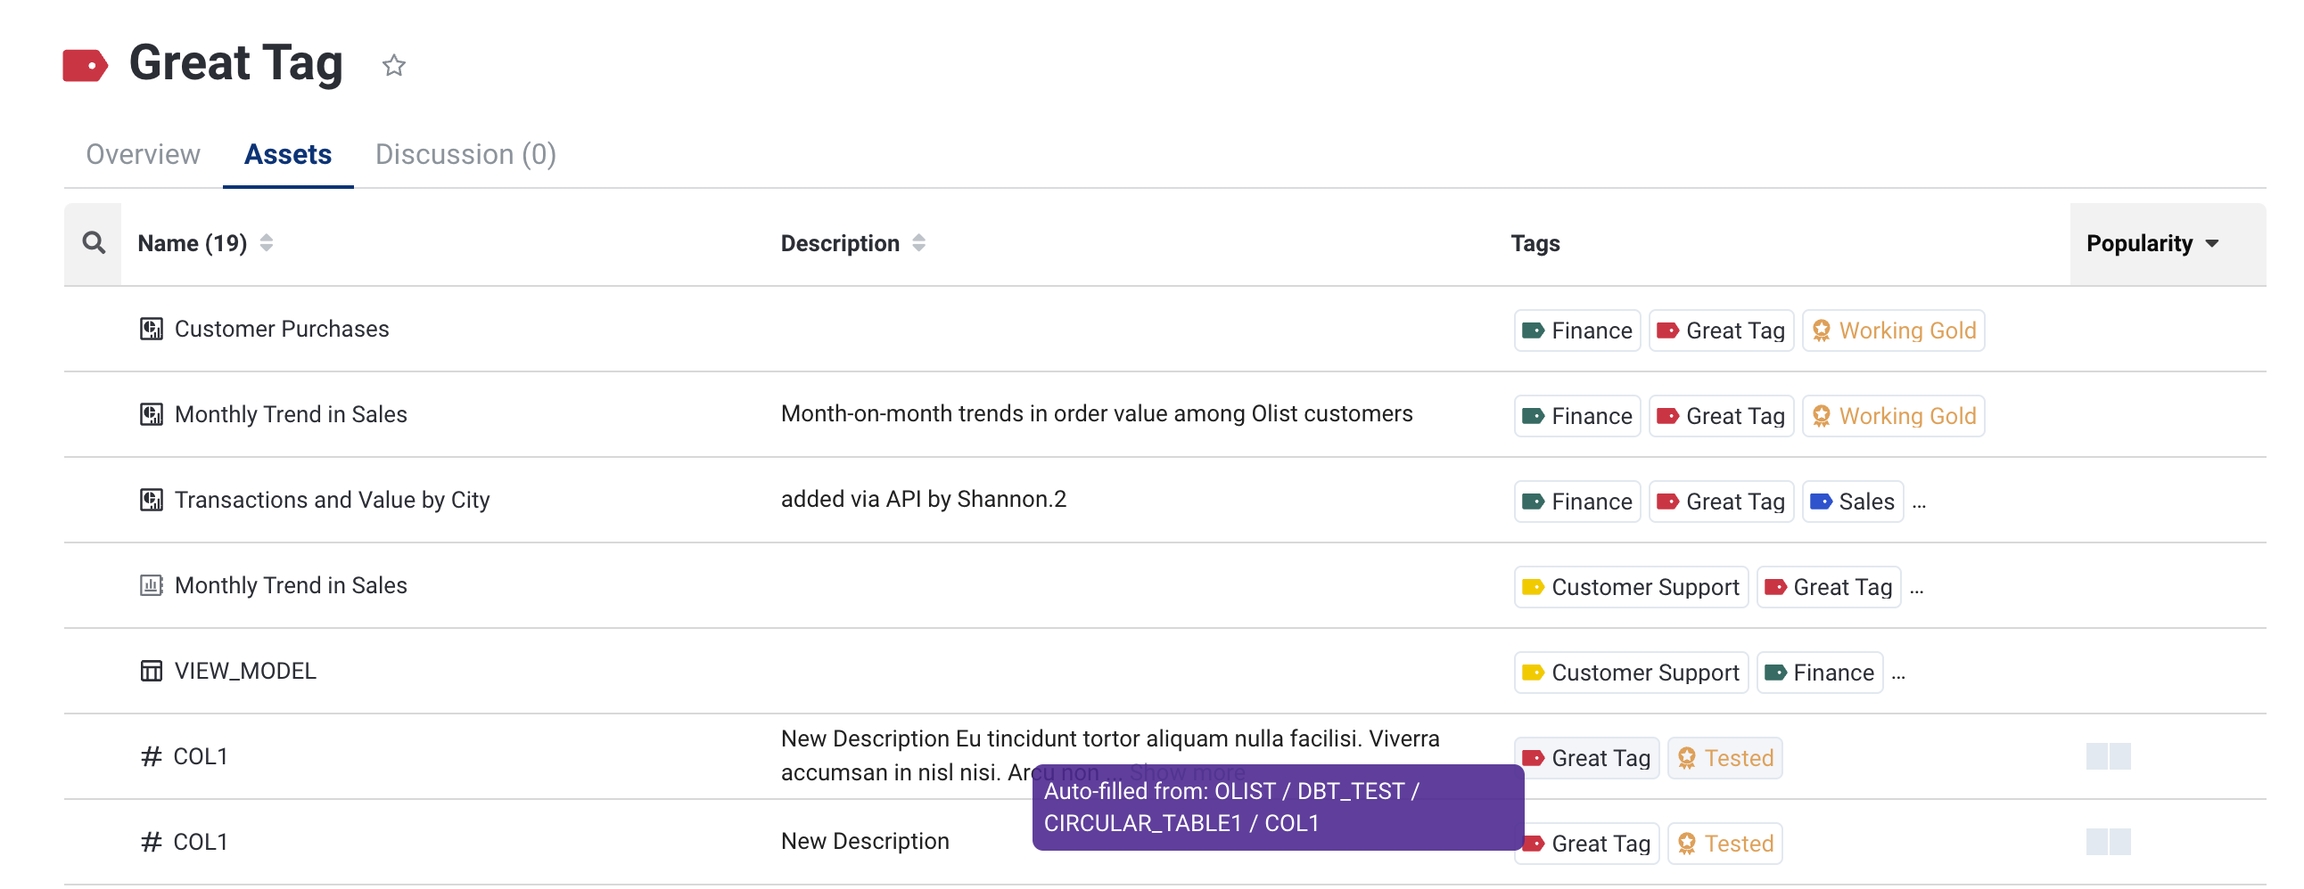
👆 Suggested tags show up in a grey background. Upon hover, you can see where the tag is auto-filled from.
It's always feeling excited when we bring some product update news! Have a great weekend everyone!
August 26, 2022 - 📍Query log processed timestamp, Updated discussion UI, and In-editor markdown rendering
1. Query log processed timestamp
Now, the timestamp of the last query logs processed is presented on the data admin page (UI). We believe this would help when you want to know if this data is up-to-date. *This update is only for databases (Snowflake, BigQuery, Postgres, and Redshift) 
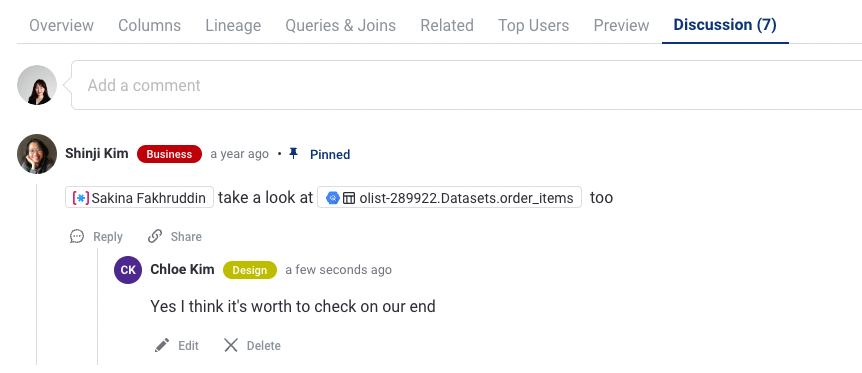
2. Updated discussion UI
We have just updated the discussion look & feel to provide a better user experience. You can easily reply, edit, and share the comments!
Previous screen

Updated screen
3. Docs: In-editor markdown rendering
Now you can use Markdown shortcuts to format plain text and generate different outputs. Please refer to what markdown elements we support at this moment:
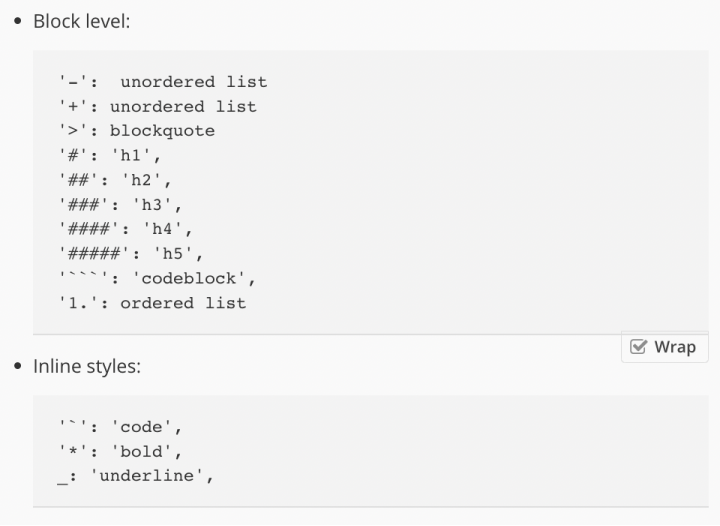
We are sure that this feature will make your documentary experience even better.

Also, when pasting a link into the editor, it would automatically be converted to a hyperlink:

Play around with it and let us know what you think!
August 17, 2022 - 📍 ERD on specified tables, Updated Mention Search, and Multiple fields for Metrics
1. ERD Filters
We've received a lot of comments that ER Diagram is so useful! To make it more practical, we start to support generating ERD tables based on specified tables. In ERD explore, you can also uncheck some checkboxes of selected tables to see the relationship between the remaining tables.

Tip!💡 You can share your ER Diagram link with your co-workers!

2. Revamped Mention Search
The updated mention search has just been released today! If you are looking specifically for a looker explore or dashboard in mention search, for example, now what you need is just type the search keyword and tick the box for the data type such as looker explore. You can use this in doc, metrics, and descriptions in general.

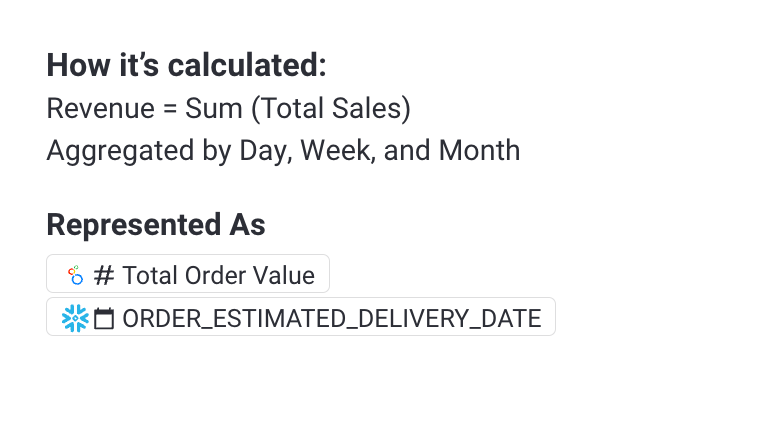
3. Multiple fields for Metrics
Previously, metrics were designed to accept only numbers or BI measure fields. We have made updates to have any type of multiple fields in metrics by using the renovated mention search.
July 28, 2022 - 📍 Revamped tag page, tables in docs, and Snowflake PK/FK
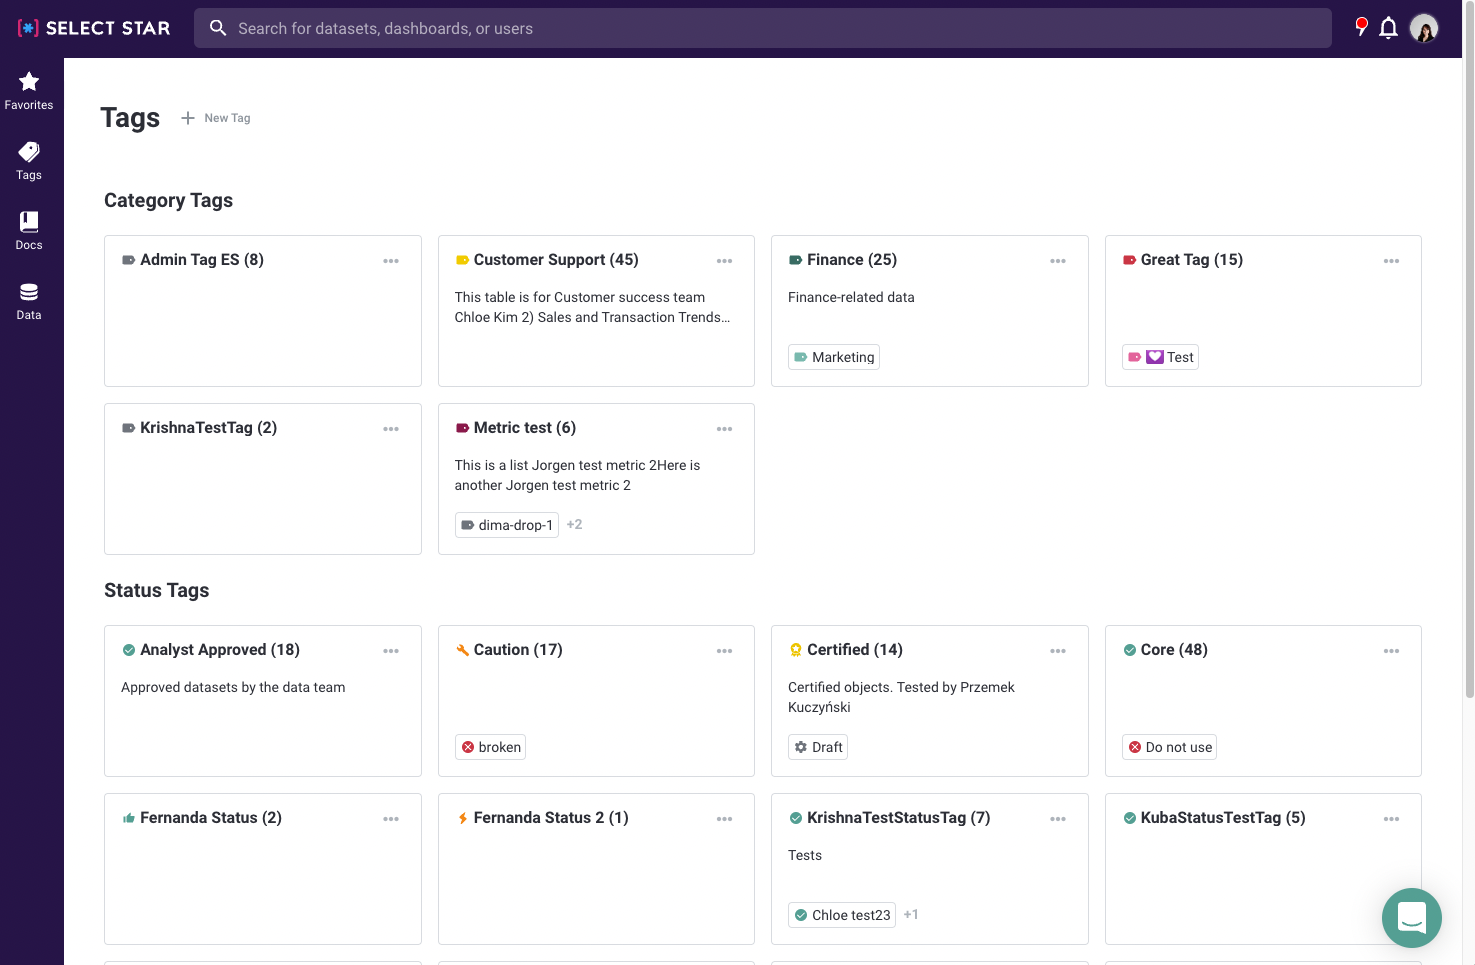
1. Tag page Design Update
This revamped tag page can help you take a closer look at what nested tags are and what the tag is for.\

Tip💡 You can generate ER Diagram by selecting checkboxes of data in the asset tab.
2. Table feature in the editor
The new editor feature 'Table' has just been added. It allows you to insert the table itself and mention the table, doc, metric, and person in it! Tip💡Don't forget to type @ and a few characters to use mention search)

3. Search results sorting by popularity
Explore the search result based on popularity.

4. Snowflake PK/FK display
Maybe some of you have already noticed this.. If you have added primary and foreign keys in Snowflake, it will automatically be shown after scheduled ingestion.
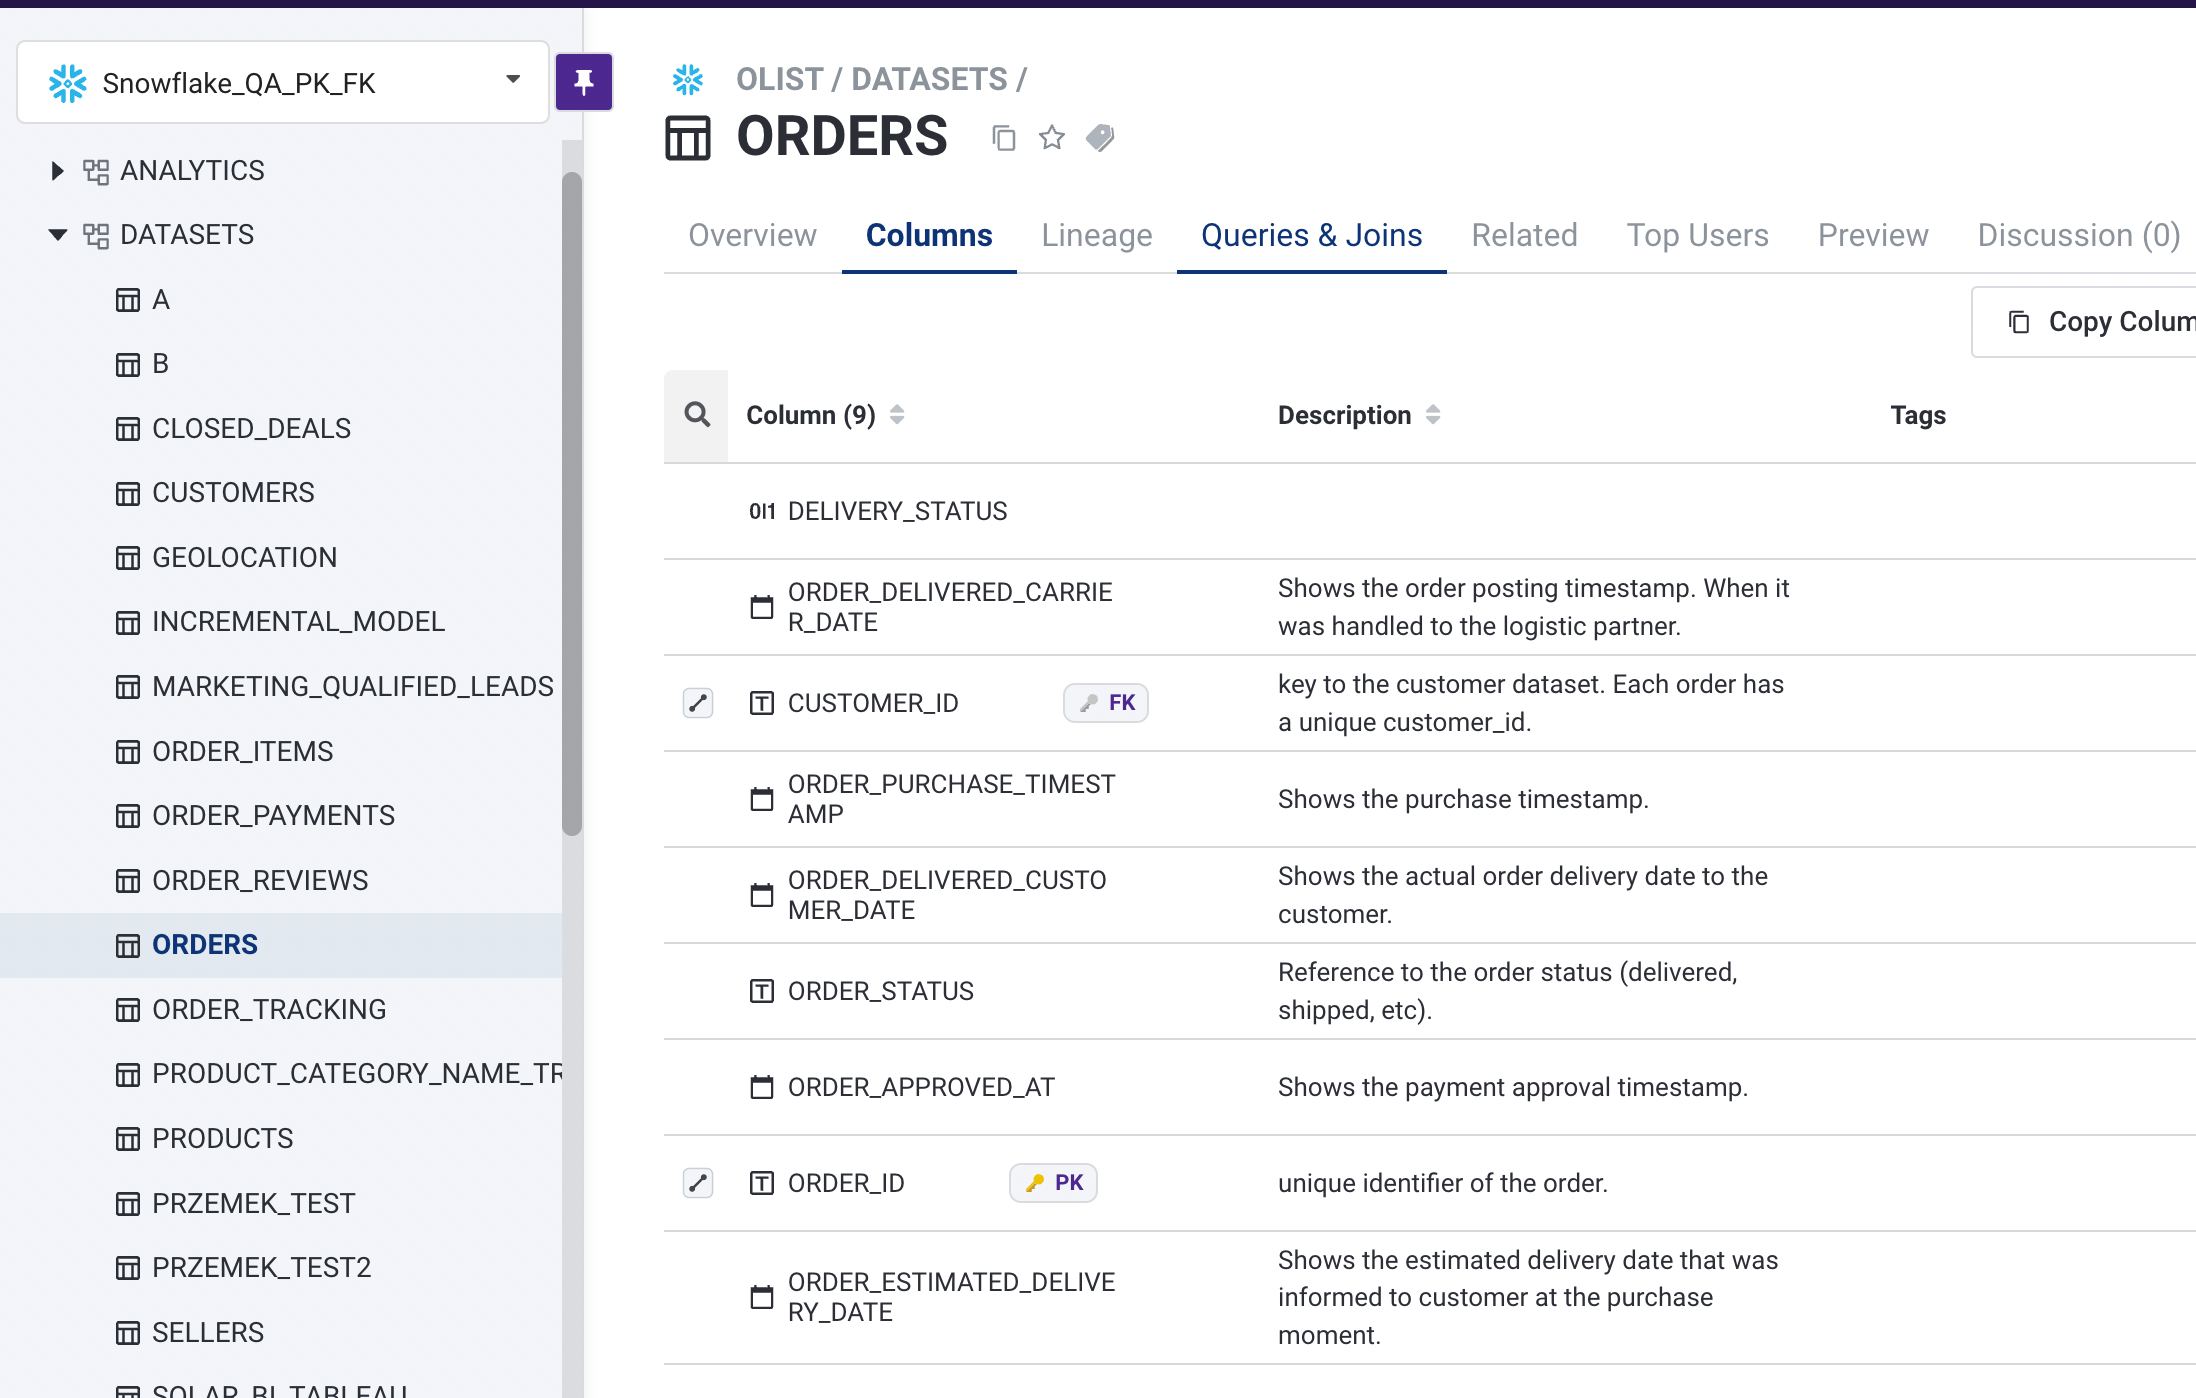
We're excited to bring more features next week! Will get back to you soon with more good news.🥳
July 14, 2022 - 📍 Copy/paste the full path of the data, Tableau custom SQL + more!
1. Bulk update API
We have updated Select Star API to update multiple descriptions of multiple objects. 👉 See our API doc for the detail: https://api.production.selectstar.com/docs/#operation/metadata_bulk_update
2. Copy/paste the full path
With just one click, you can now copy and paste the full path of the data!

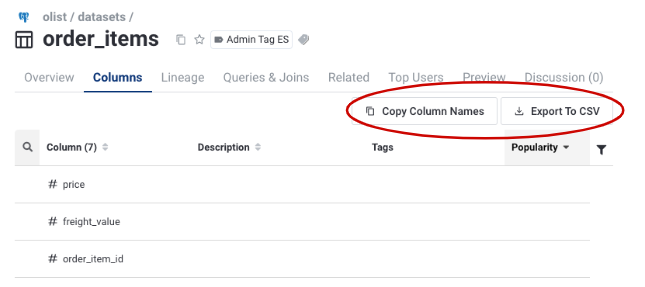
3. Copy/download column names
For each table, you can now copy or export all the columns information. Look for these export buttons on the Columns tab:
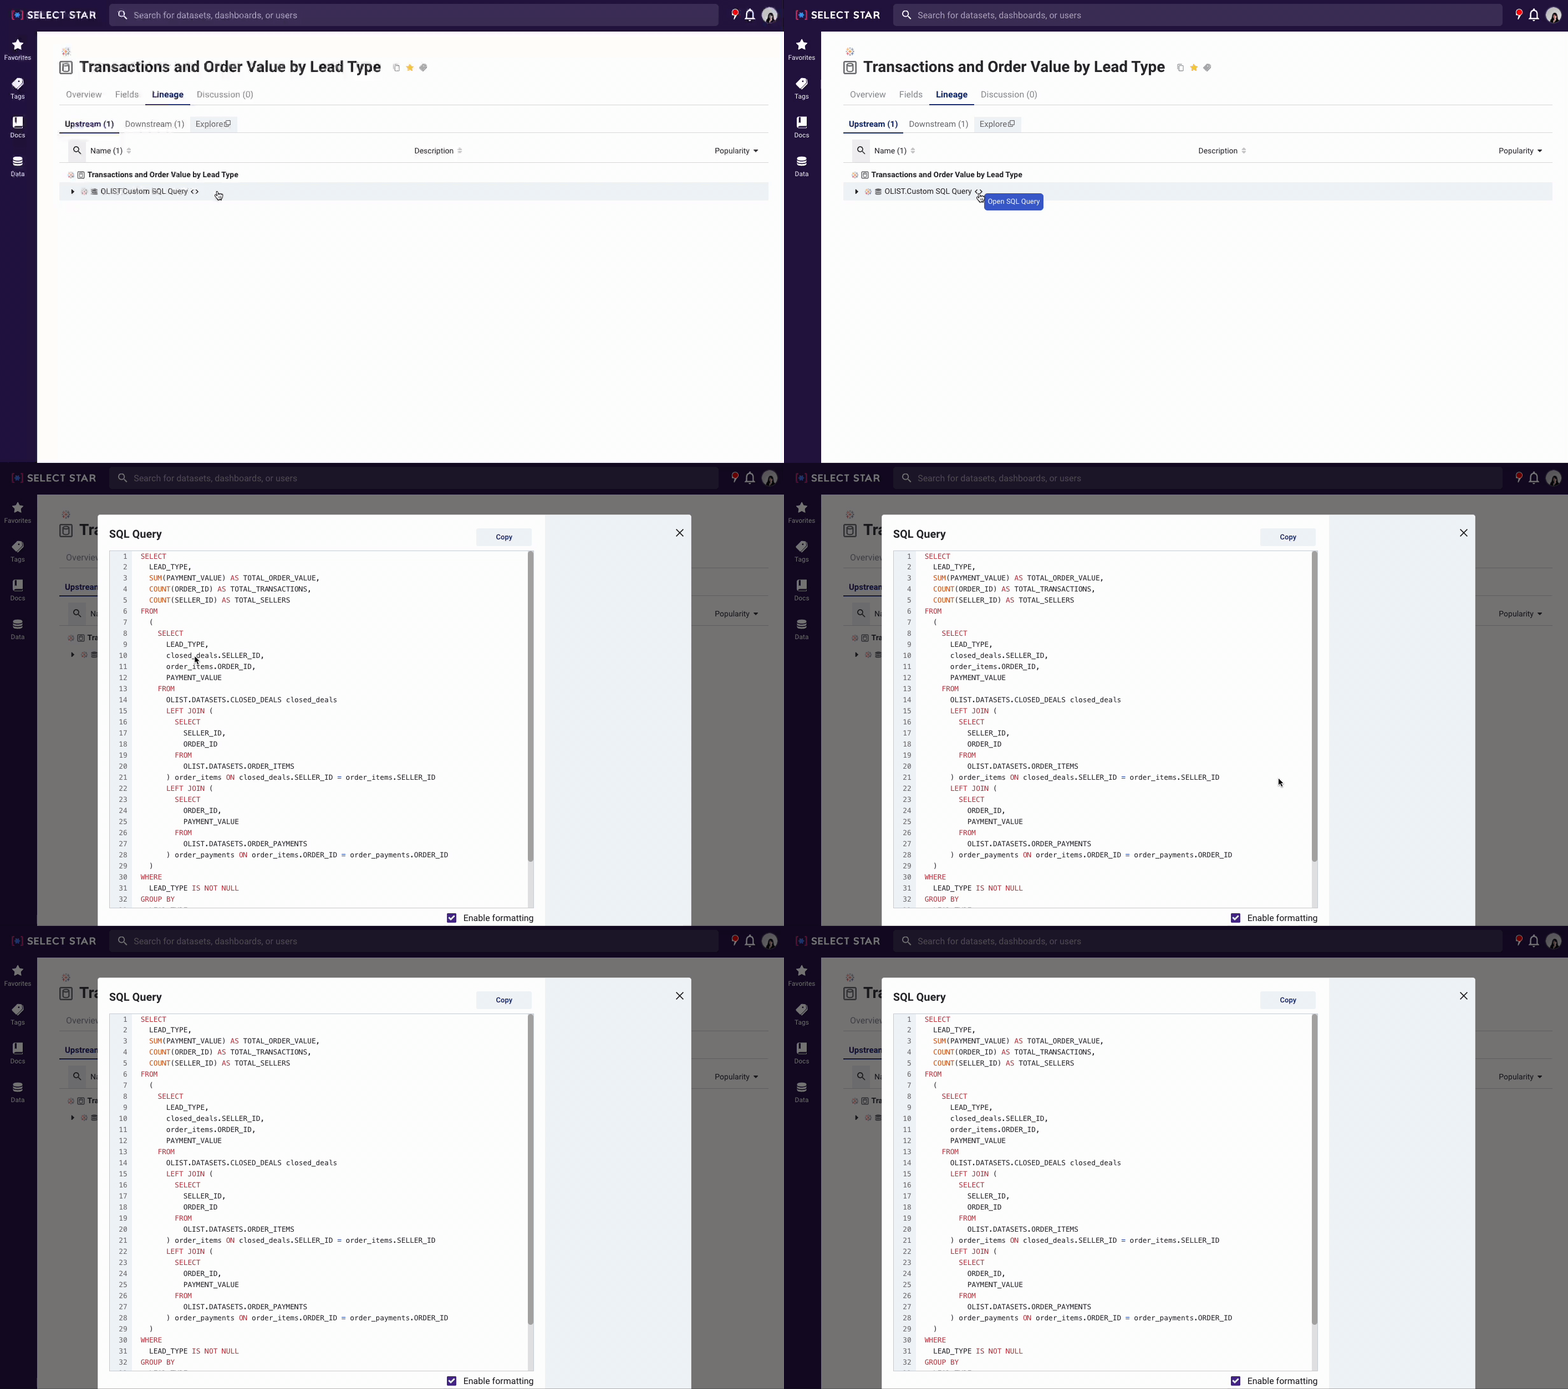
4. See tableau custom SQL Query directly from the lineage
While looking through upstream and downstream in tableau, you can check custom SQL in Select Star.
July 7, 2022 - 💫 Editor updates, Metabase Integration, and more!
✔️ Docs / Description Editor update
1. Styling & multi-line support for column descriptions You can now add line breaks, and style text easily for Column / Field descriptions. Yes, keyboard shortcuts like Ctrl+B for bold is supported too.

** 2. Floating editor** Within the edit fields, we're also introducing a floating editor. Just highlight the text you want to format, and a floating editor will appear with some styling options. We hope that this makes it easier and faster to edit your text in the database, schema, and column level.

✔️ Metabase Integration
Metabase integration is one of the most requested integrations from our customers. So now we have it! You can explore Metabase data lineage, popularity, and more in Select Star 🤩
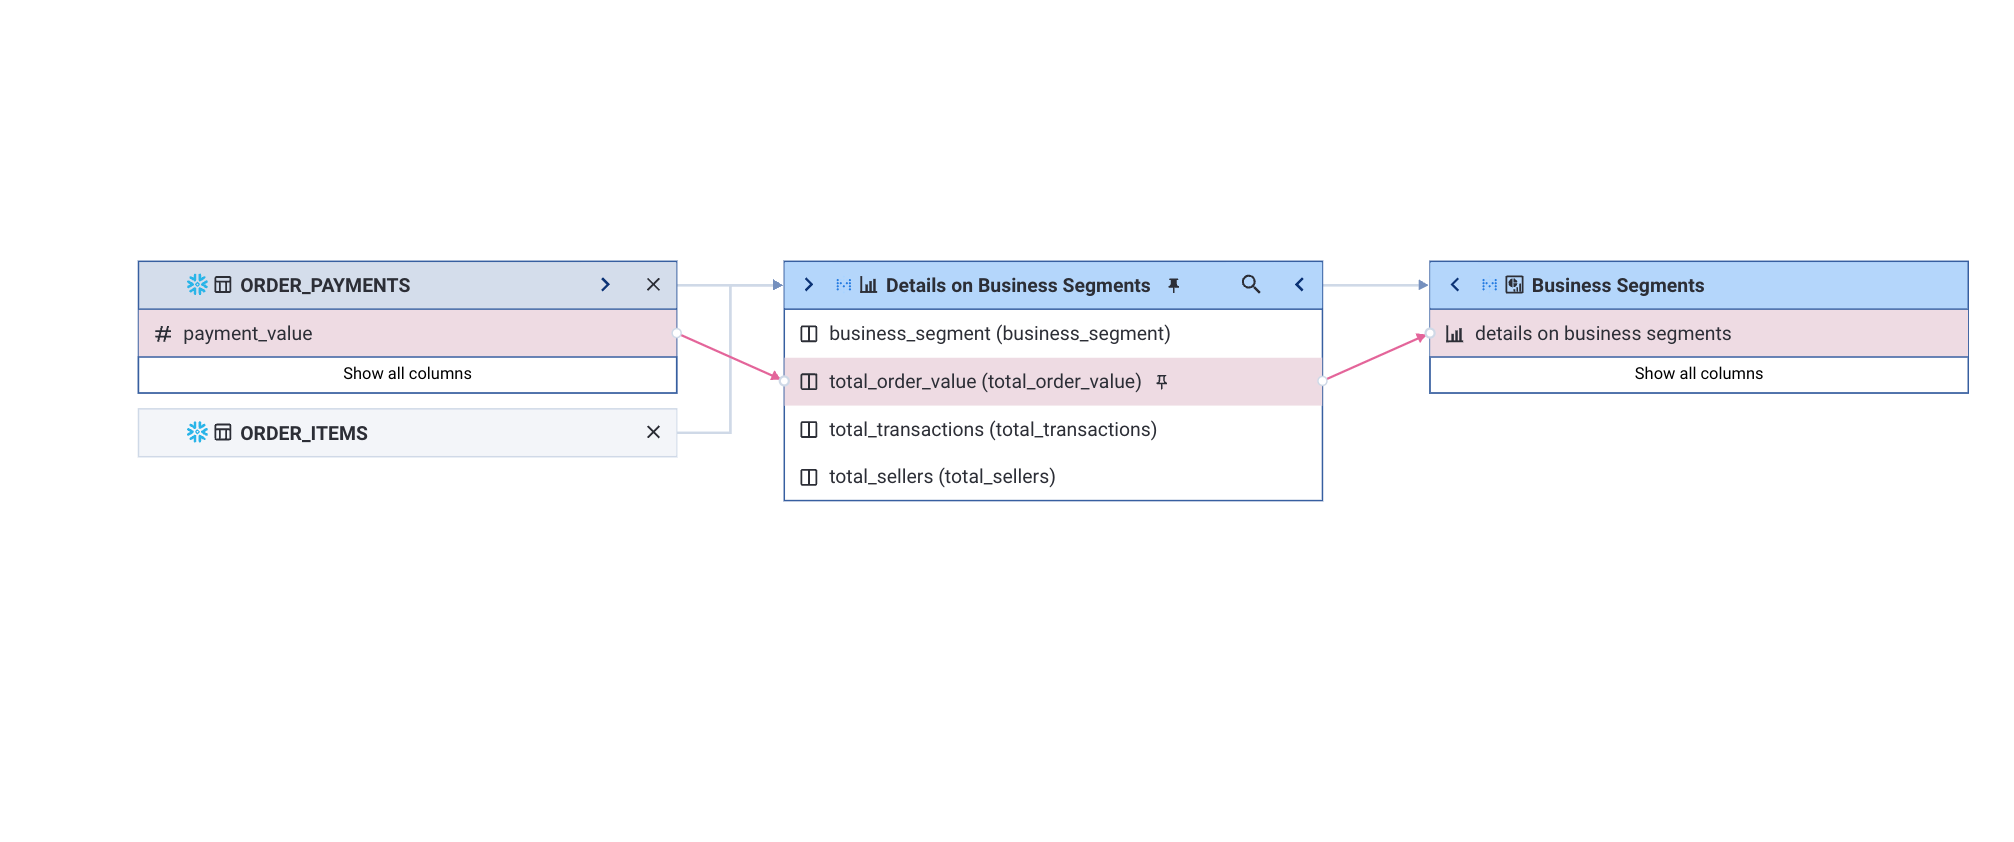
You can check more information here - Metabase Integration Docs
✔️ Postgres / Redshift integration update
We have made it simpler, faster, and more secure to configure Select Star integration with AWS RDS for PostgreSQL and for AWS Redshift. It has been automated with AWS CloudFormation, which means no more IAM config changes. Now you can create and flawlessly configure a new data source for these services with a few simple steps: Redshift Integration Docs
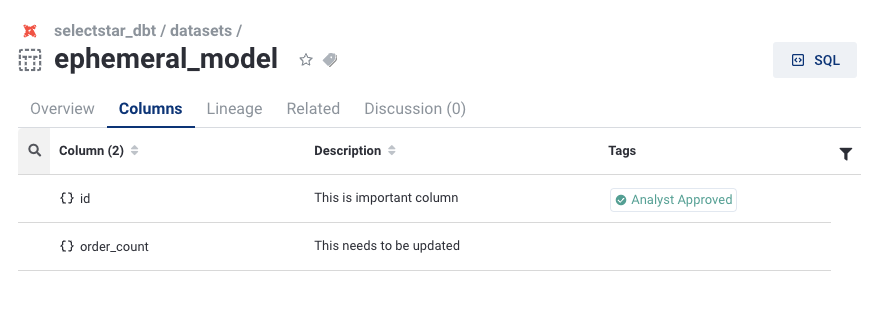
✔️ dbt Cloud columns for ephemeral models
Ephemeral models weren't supported natively from dbt Cloud APIs, but we've added support to display the column level information ✨
June 20, 2022 - 📍 New Overview tab + Text editor improvements 🖌 💫
We are moving to a cleaner, more spacious UI following the sidebar update ✨
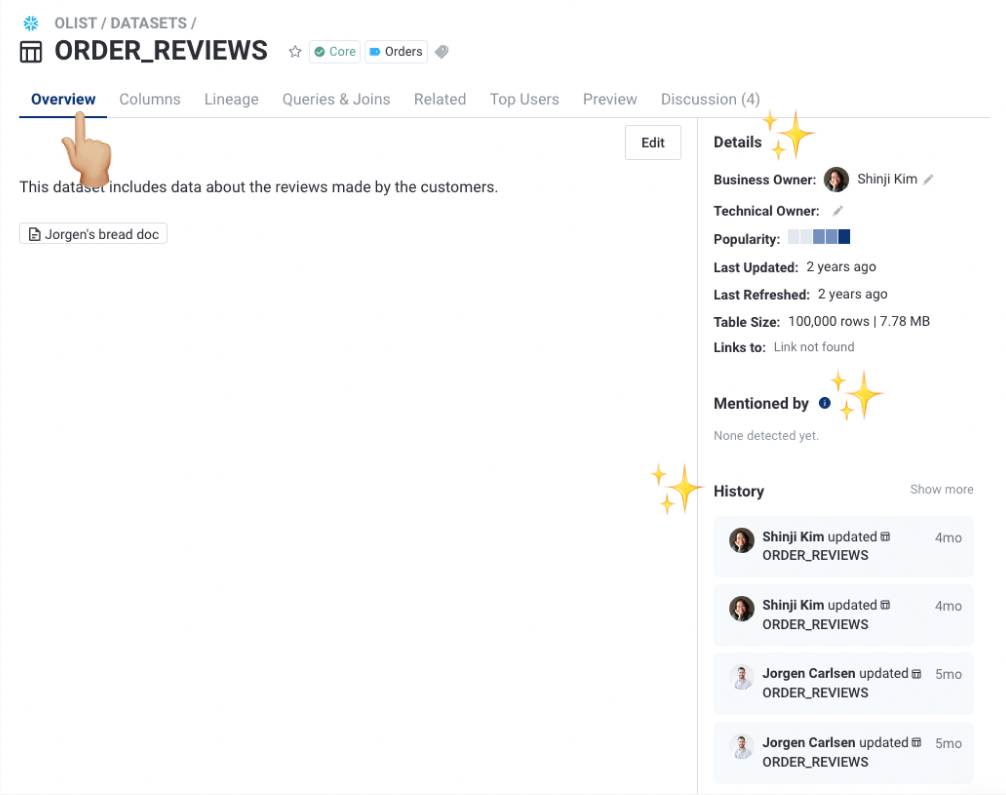
📍 Overview tab
Now you can add text documentation for your tables and dashboards!
With the new overview tab, you can document the information as much as you want. If the table is mentioned by other docs or other objects, we’ll also show a backlink on the Overview tab:
📑 Docs update: Select Star now supports inline code and images🖌
How to Add Inline Code
Step 1. Highlight the portion that you want to change to inline code.
Step 2. Click on the inline code icon in the text editor.
How to Add Image
You can add images by one of the following ways:
Pressing image button in toolbar and uploading from computer.
Dragging and dropping file from computer.
Copy and pasting file from computer.

We've been impressed by lots of users using our docs for their data documentation! We’d love to hear what you think of the new updates 💌
June 15, 2022 - Auto-generated ERD (Entity-Relationship Diagram)
Today, we are releasing Auto-generated ERD (Entity-Relationship Diagram) in order to better support data analysts and citizen data scientists to understand and leverage data more effectively.
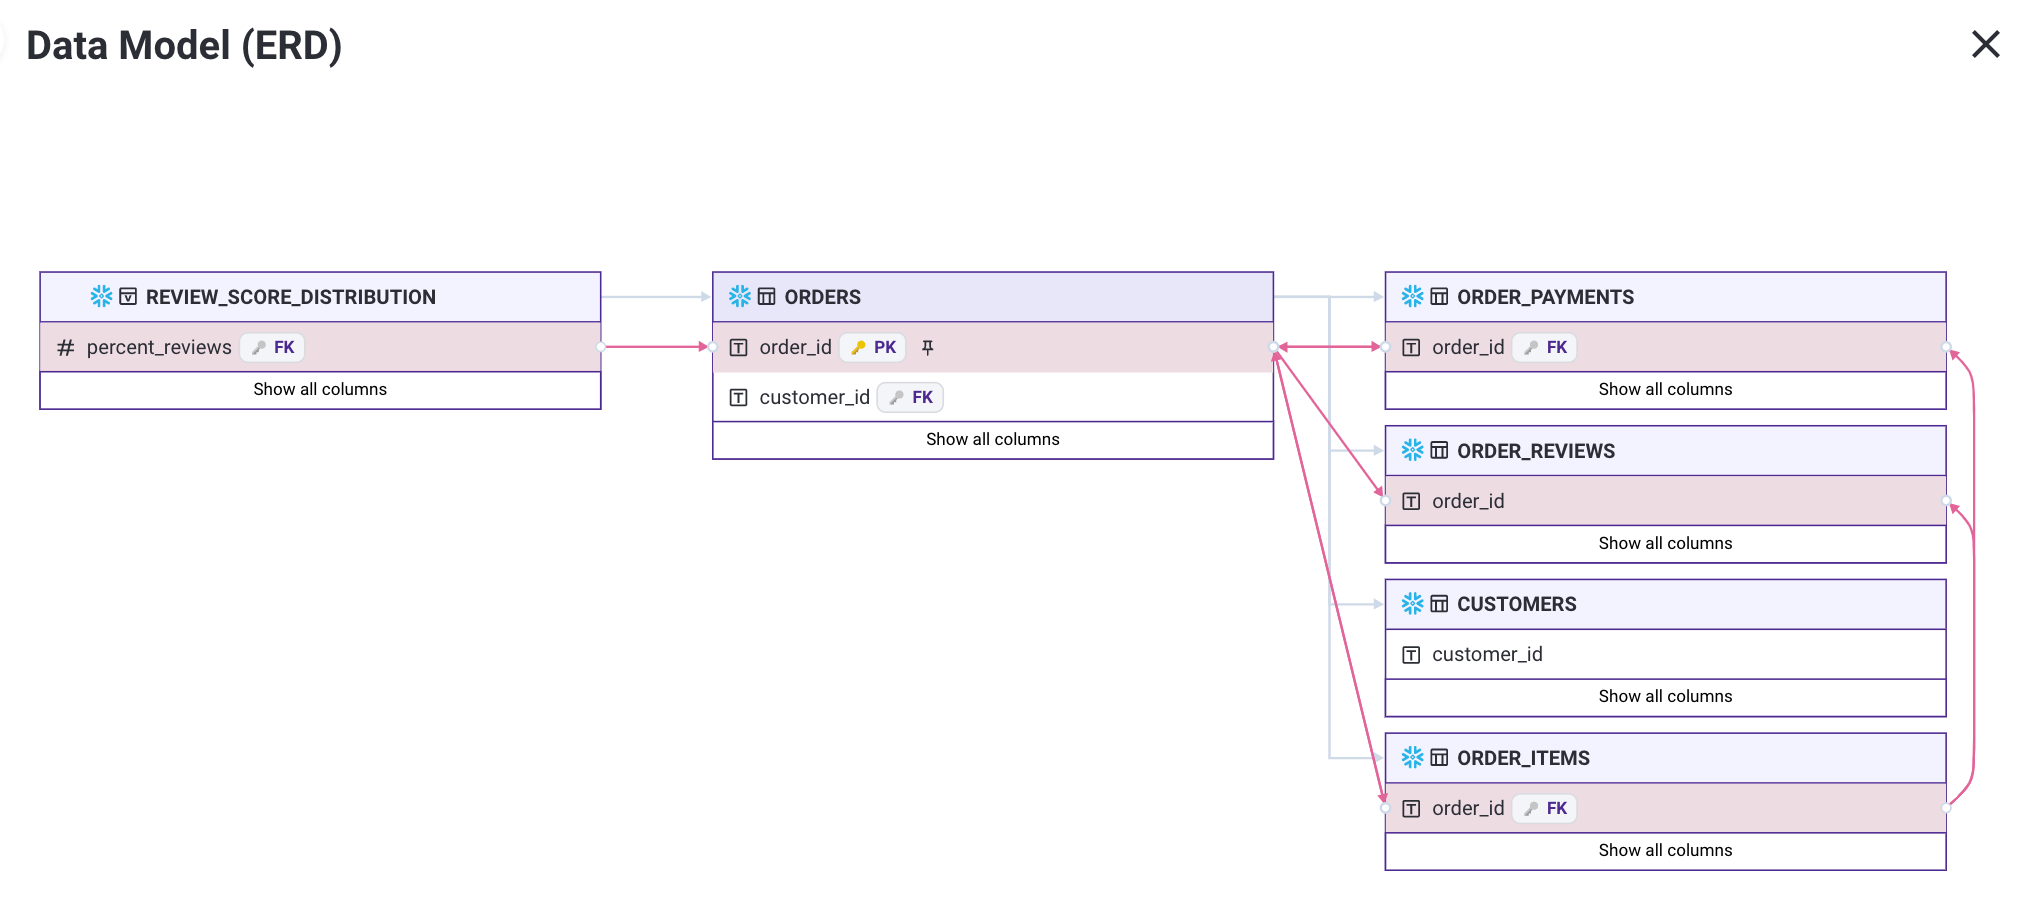
Read our blog post here: https://blog.selectstar.com/blog/automated-data-documentation-entity-relationship-diagram-erd
How to see your ER-Diagrams?
For any table, go to Queries & Joins tab and click ERD (beta):

On a database view, select tables and click ERD (beta):
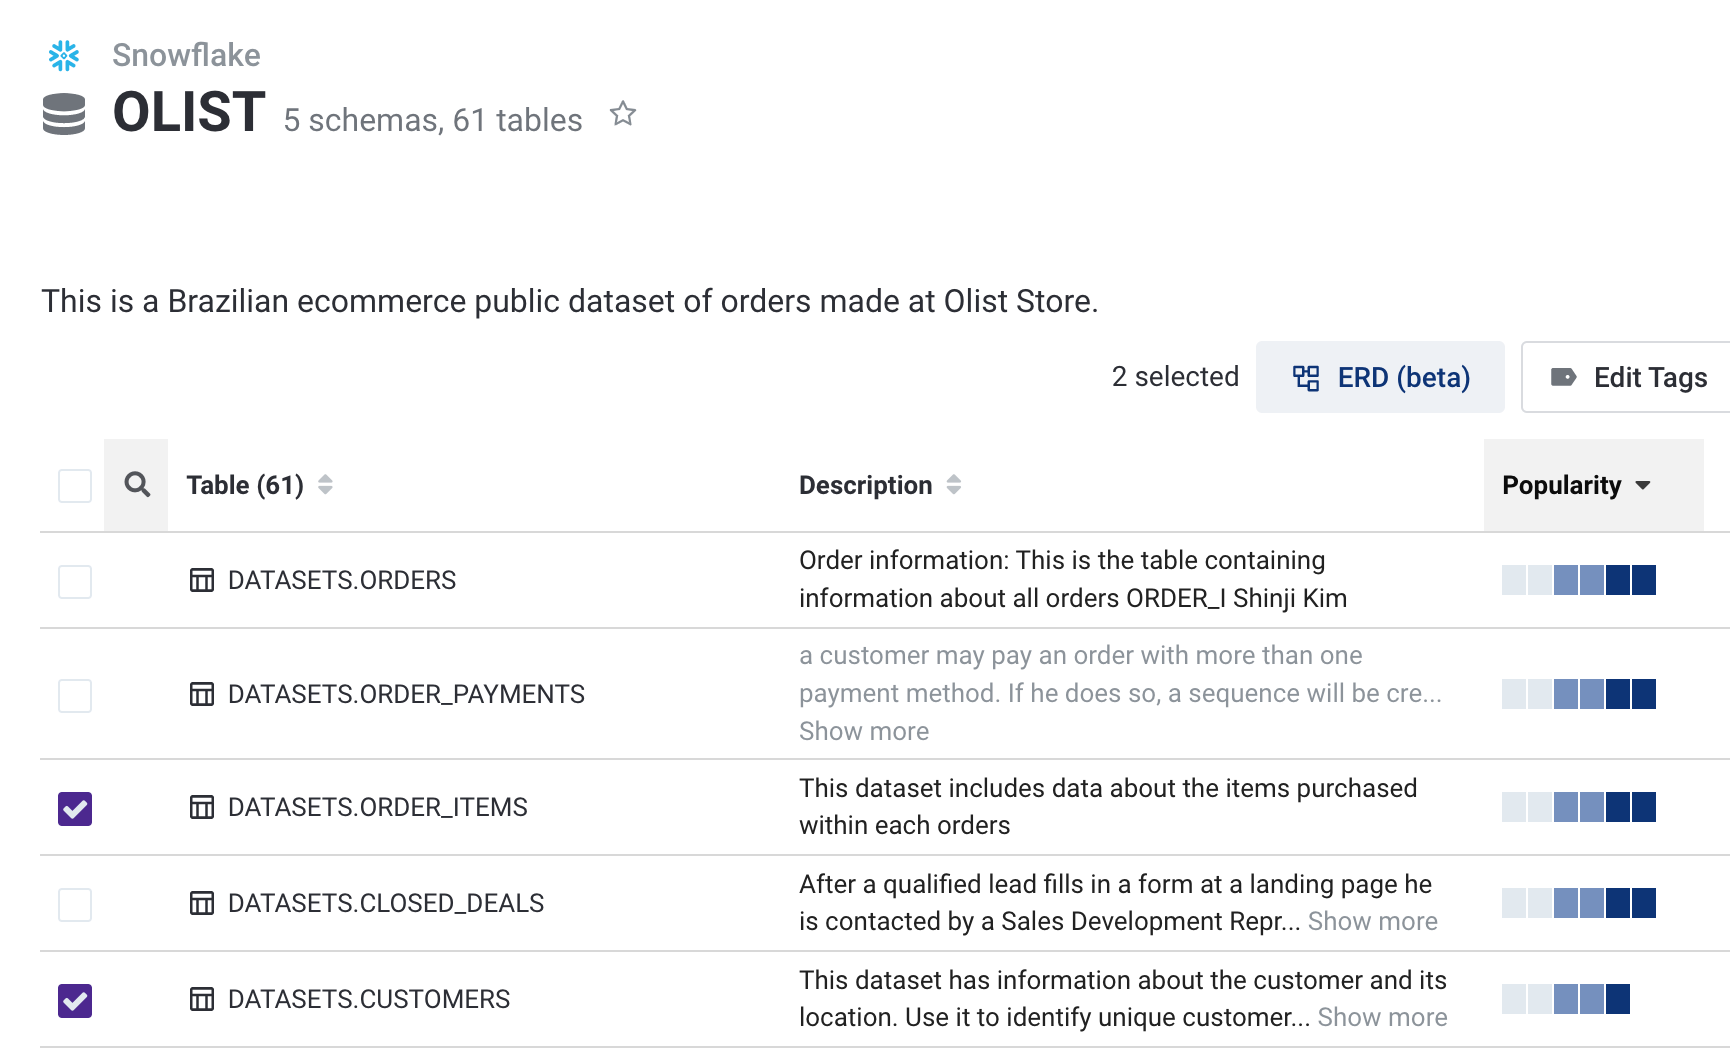
You can also do this in the Tags page -- select the tables and click Open ERD:
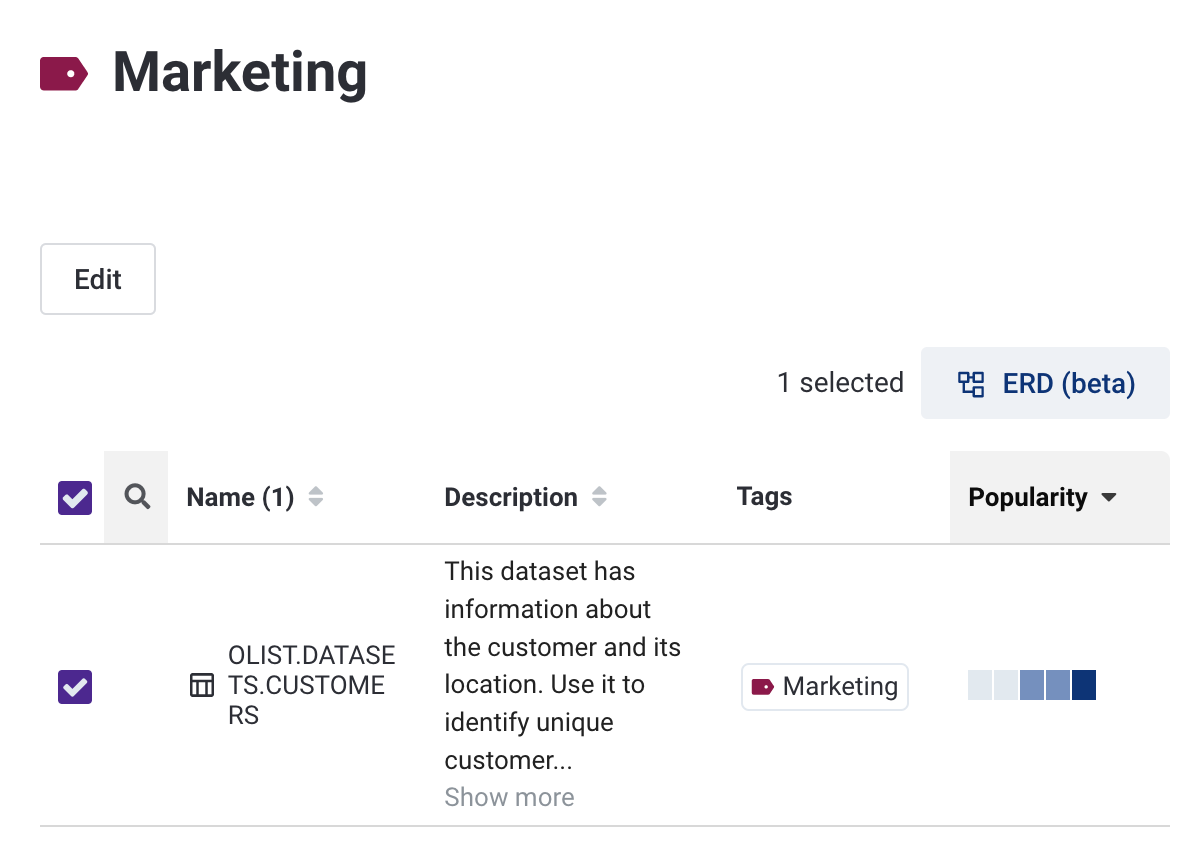
It's our very first version, so still in beta and we plan to add improvements quickly. Please let us know what you think! 😃
June 13, 2022 - Improving UX, and PowerBI Integration
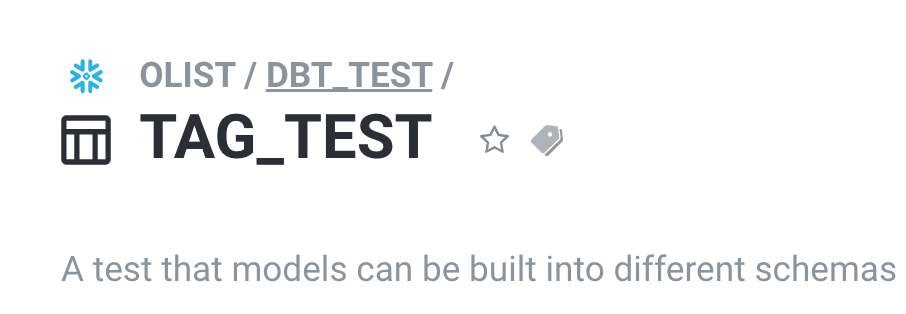
1. Breadcrumbs
Did you notice this already? You can now click on database / schema names and easily jump to the higher level page:
2. Teams page update
Easily create team name and remove teams in Settings > Team: 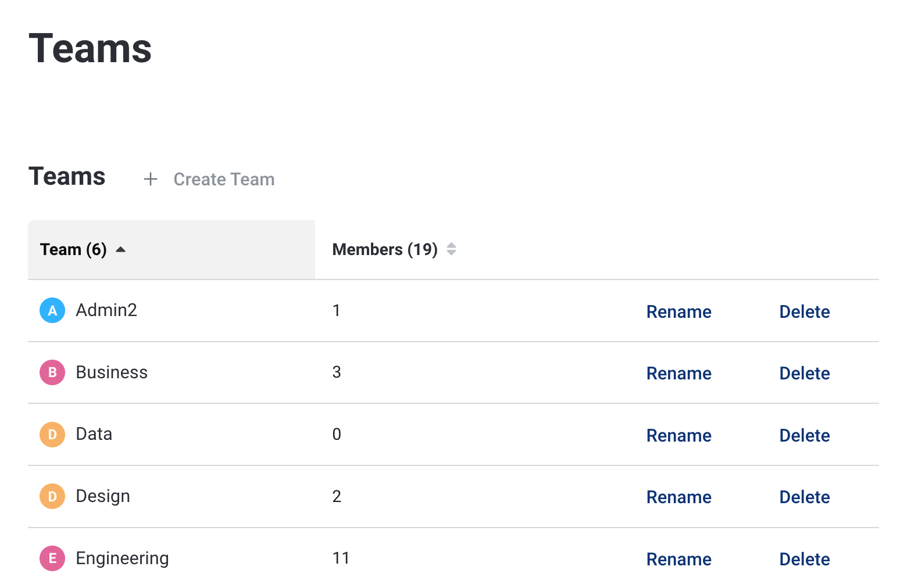
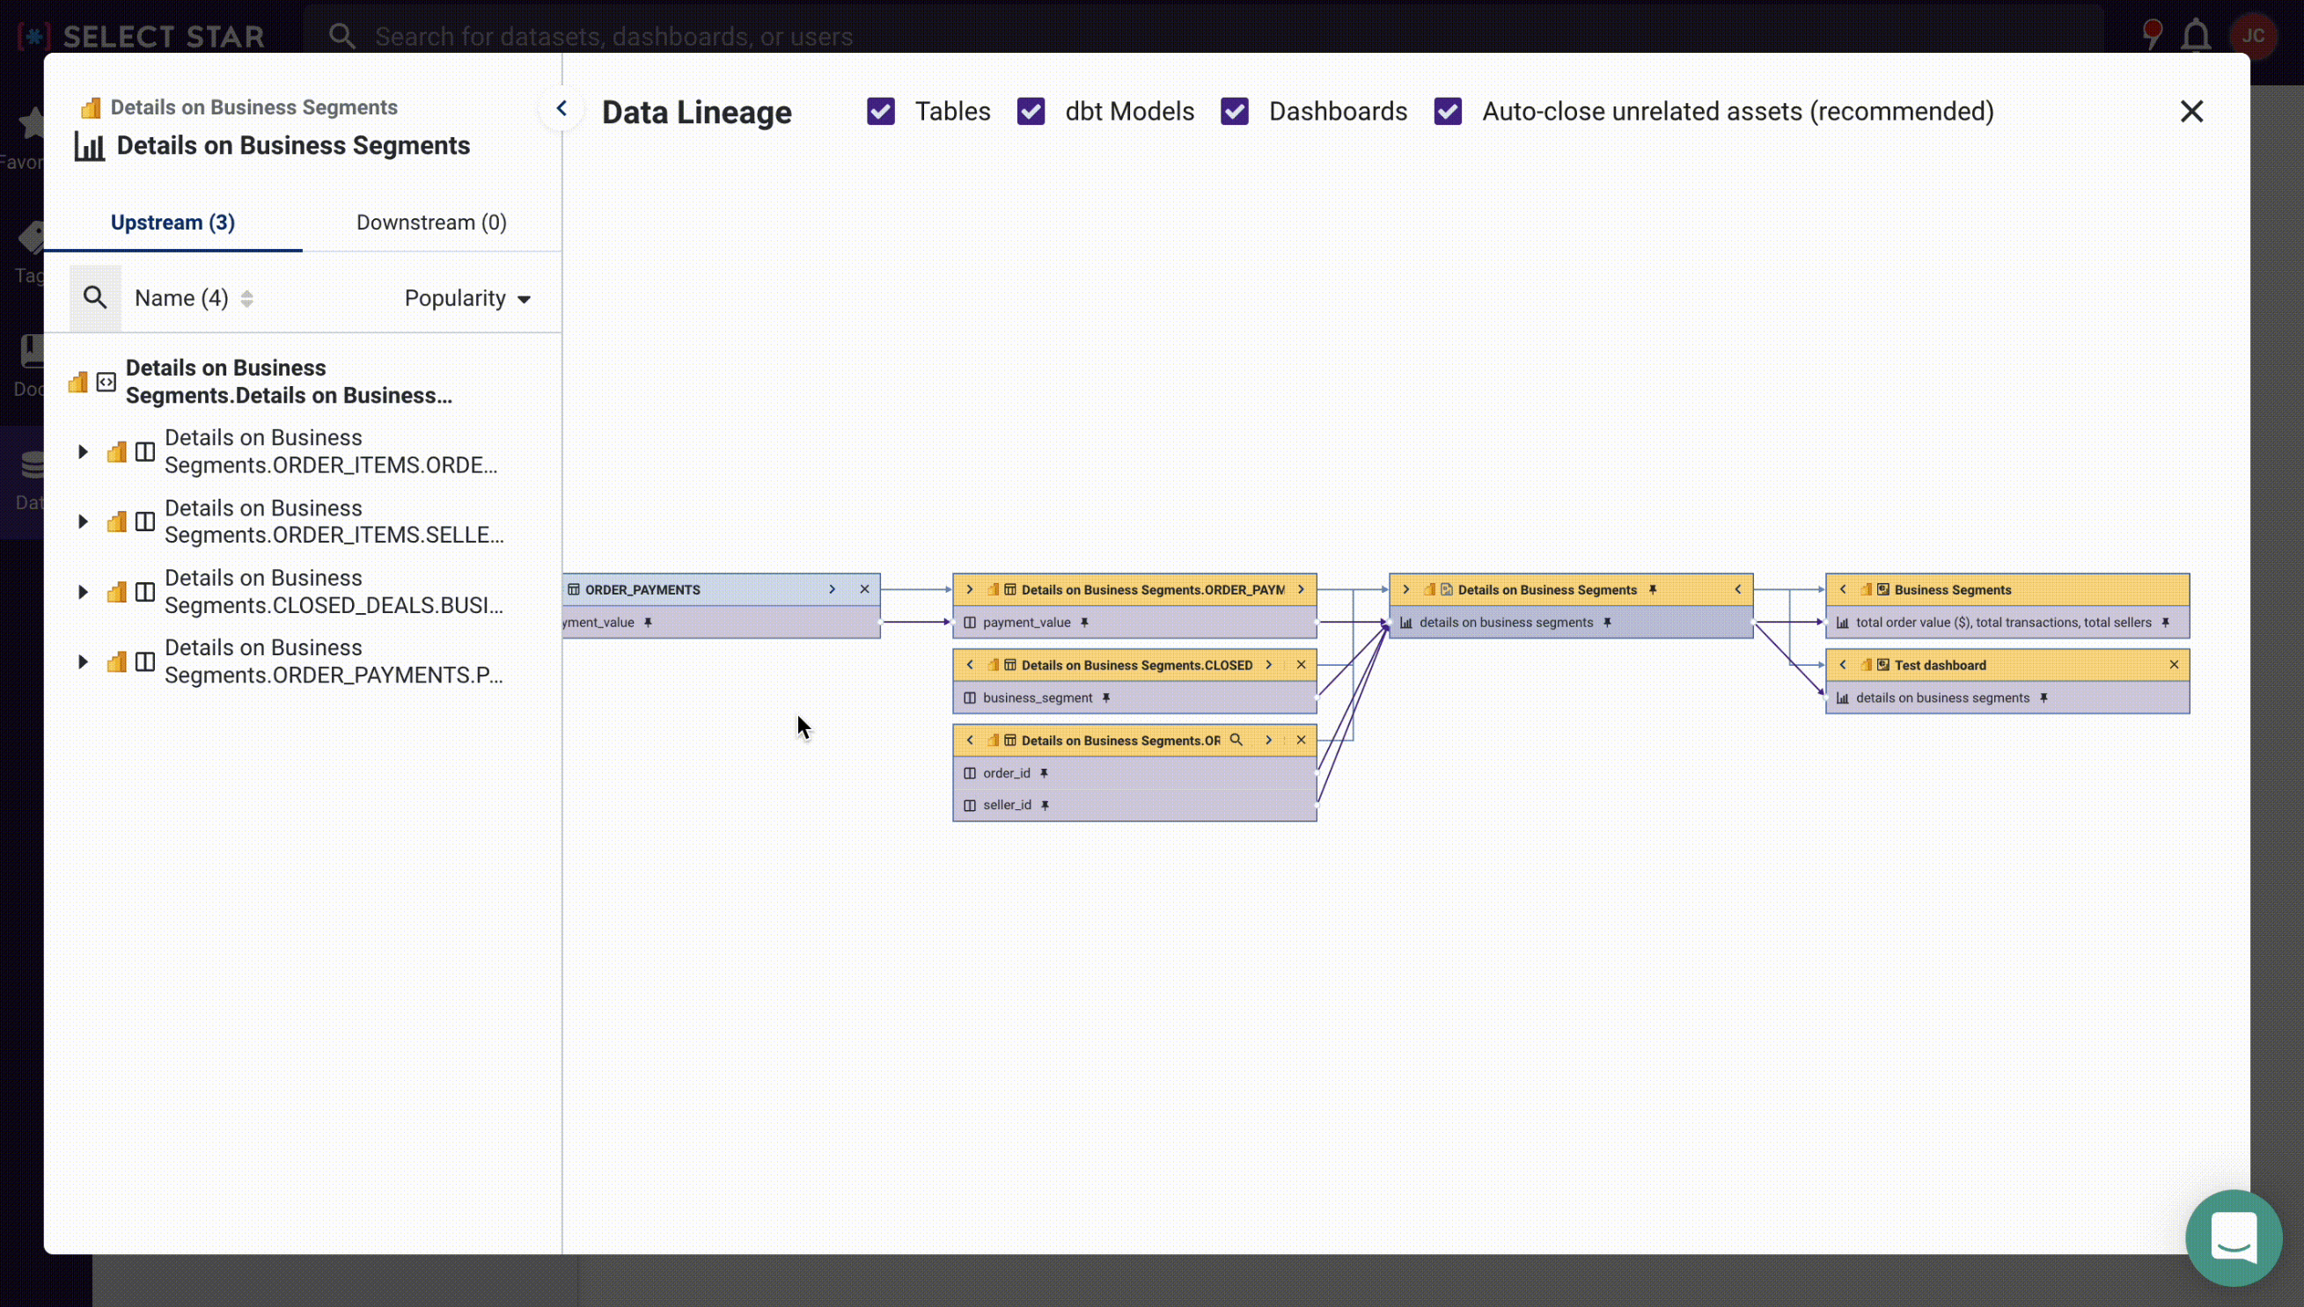
3. New Integration: PowerBI
You can now enjoy all the discovery features of Select Star for PowerBI. Column level lineage, top users, popularity... Check out our integrations docs for more: https://docs.selectstar.com/integrations/powerbi
May 31, 2022 - New Sidebar UI, dbt Cloud Support, and Full Lineage API 🚀
Lots of new updates in the last couple of weeks!
🔥 1. New Sidebar UI 🔥
In order to give you more space on the main page, we're upgrading our sidebar hierarchy:
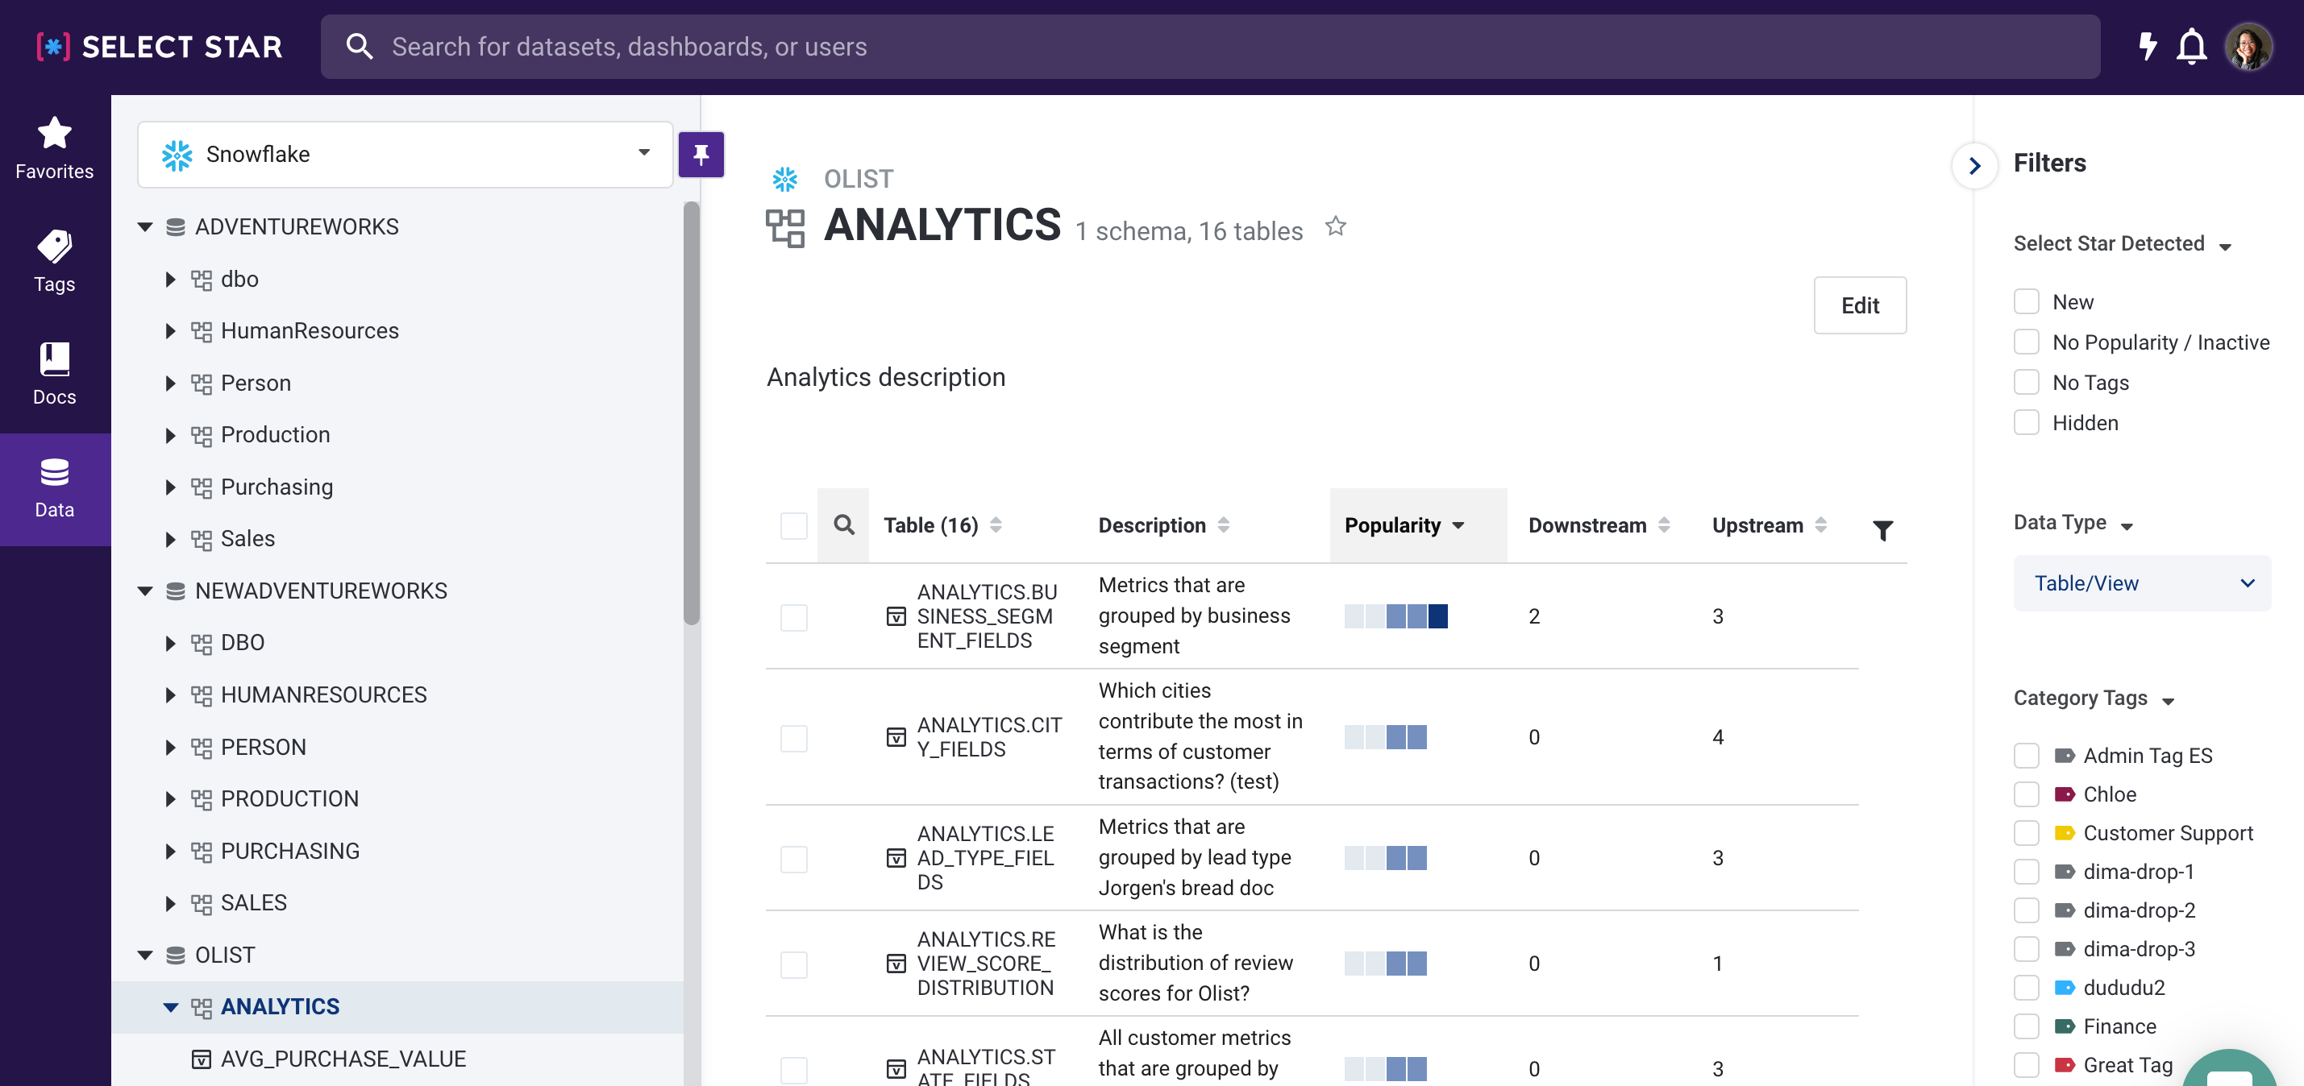
By simply unpinning the sidebar, you can now have more space:
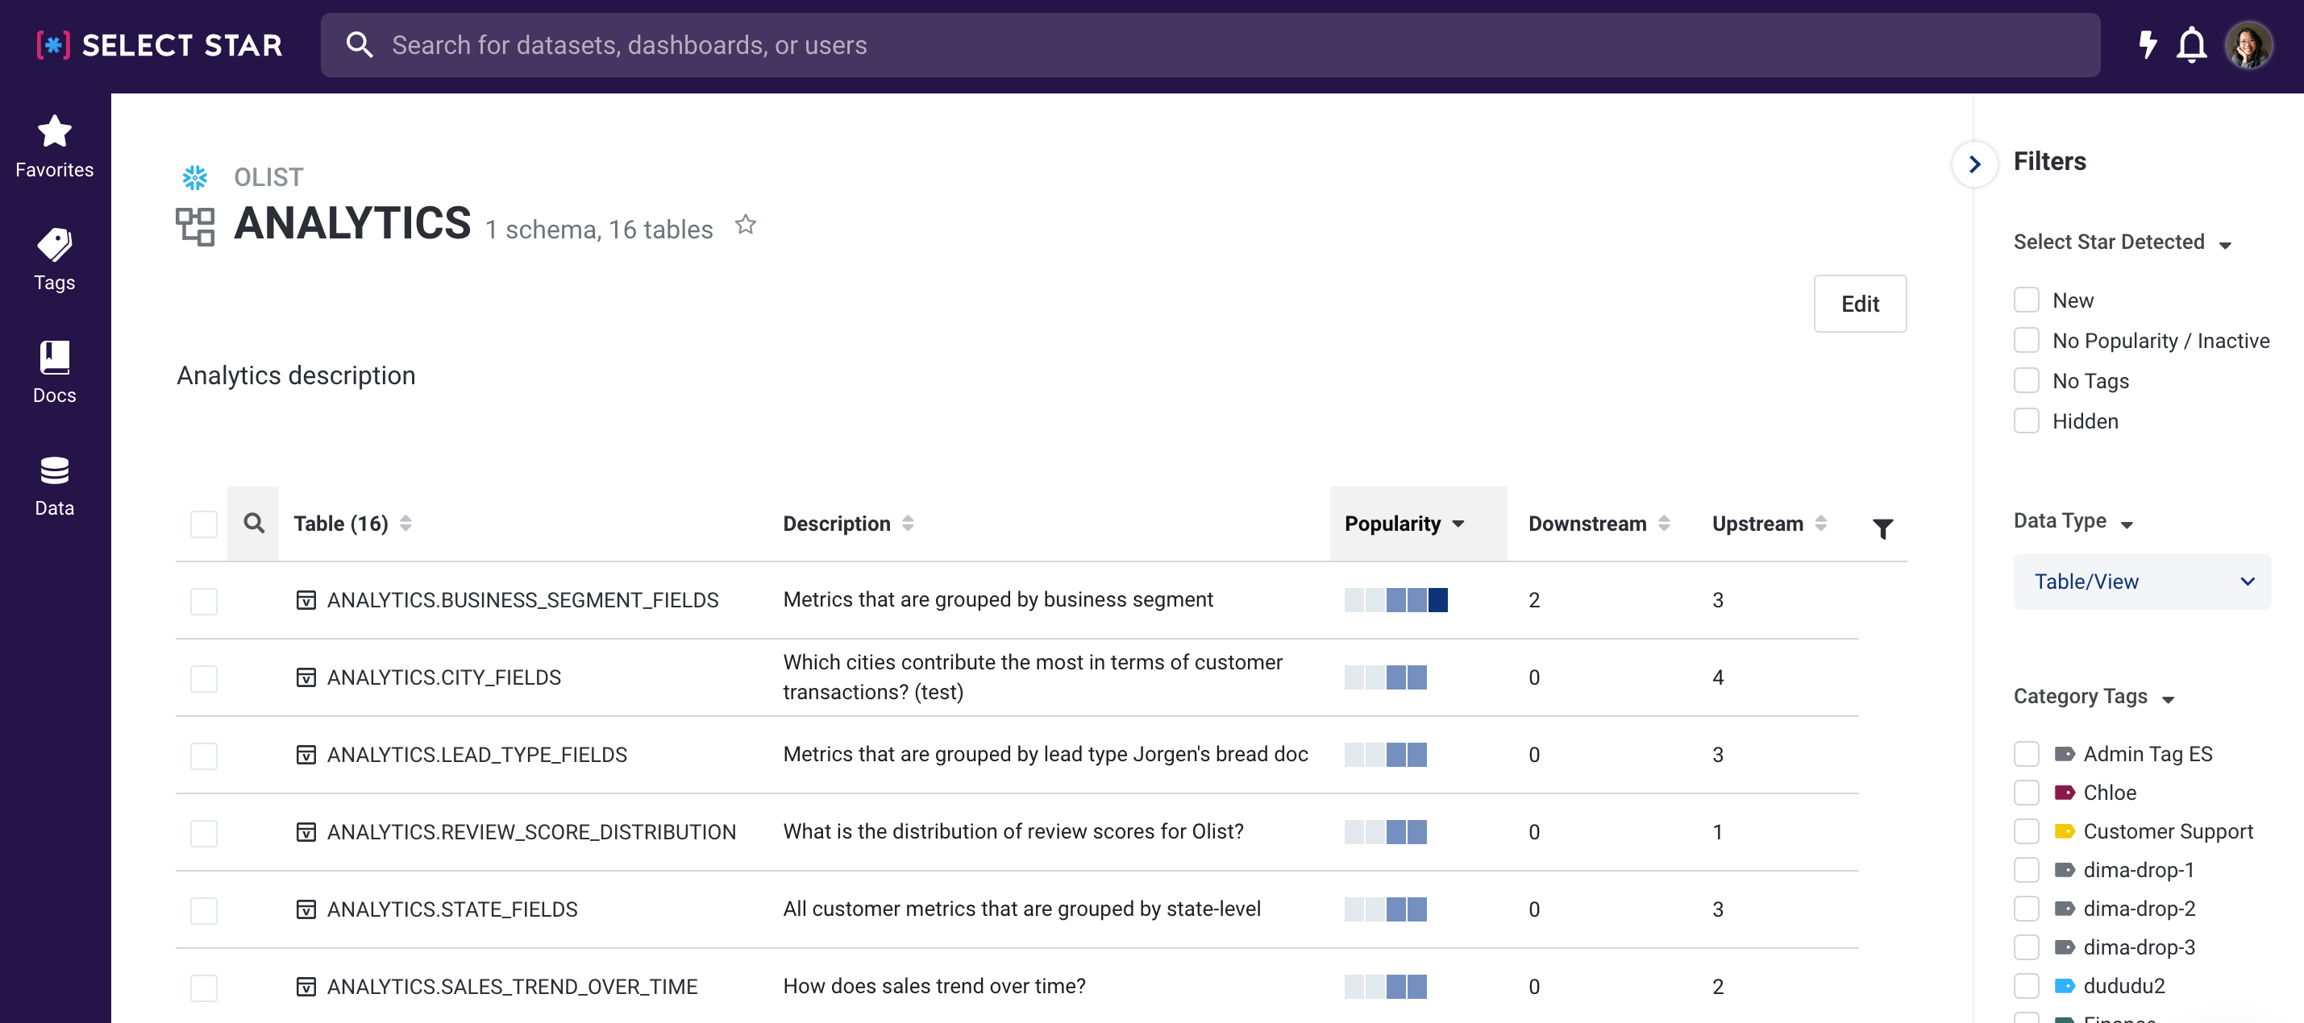
👉 If you don't want the sidebar to disappear, just pin it again.
➕ Bonus: we've removed the edit toggle -- if you're a data manager or admin, you can still update the Docs hierarchy ordering or nesting w/o the toggle.
We would love to hear what you think!
🦾 2. dbt Cloud Support 🦾
Now you can automatically update your manifest.json if you're on dbt Cloud! Check out our docs here on how to create your custom job: https://docs.selectstar.com/integrations/dbt/dbt-cloud
👩🚀 3. Full-lineage API 👩🚀
Previously, you had to traverse the graph level by level, node by node in order to get to the full lineage. We've now updated the API so you can fetch multiple levels once up to 10 -- you can also get upstream only, downstream only, or both.
Check it out from our API docs: https://api.production.selectstar.com/docs/#tag/lineage
April 27, 2022 - 🥳 User Defined Hierarchy for Tags/Docs + Discussion Counts!
User Defined Hierarchy
It's finally here - you can create your own hierarchy to nest and organize Tags, Docs, and Metrics!
If you're a data manager or admin, you should see this toggle at the bottom of the sidebar:
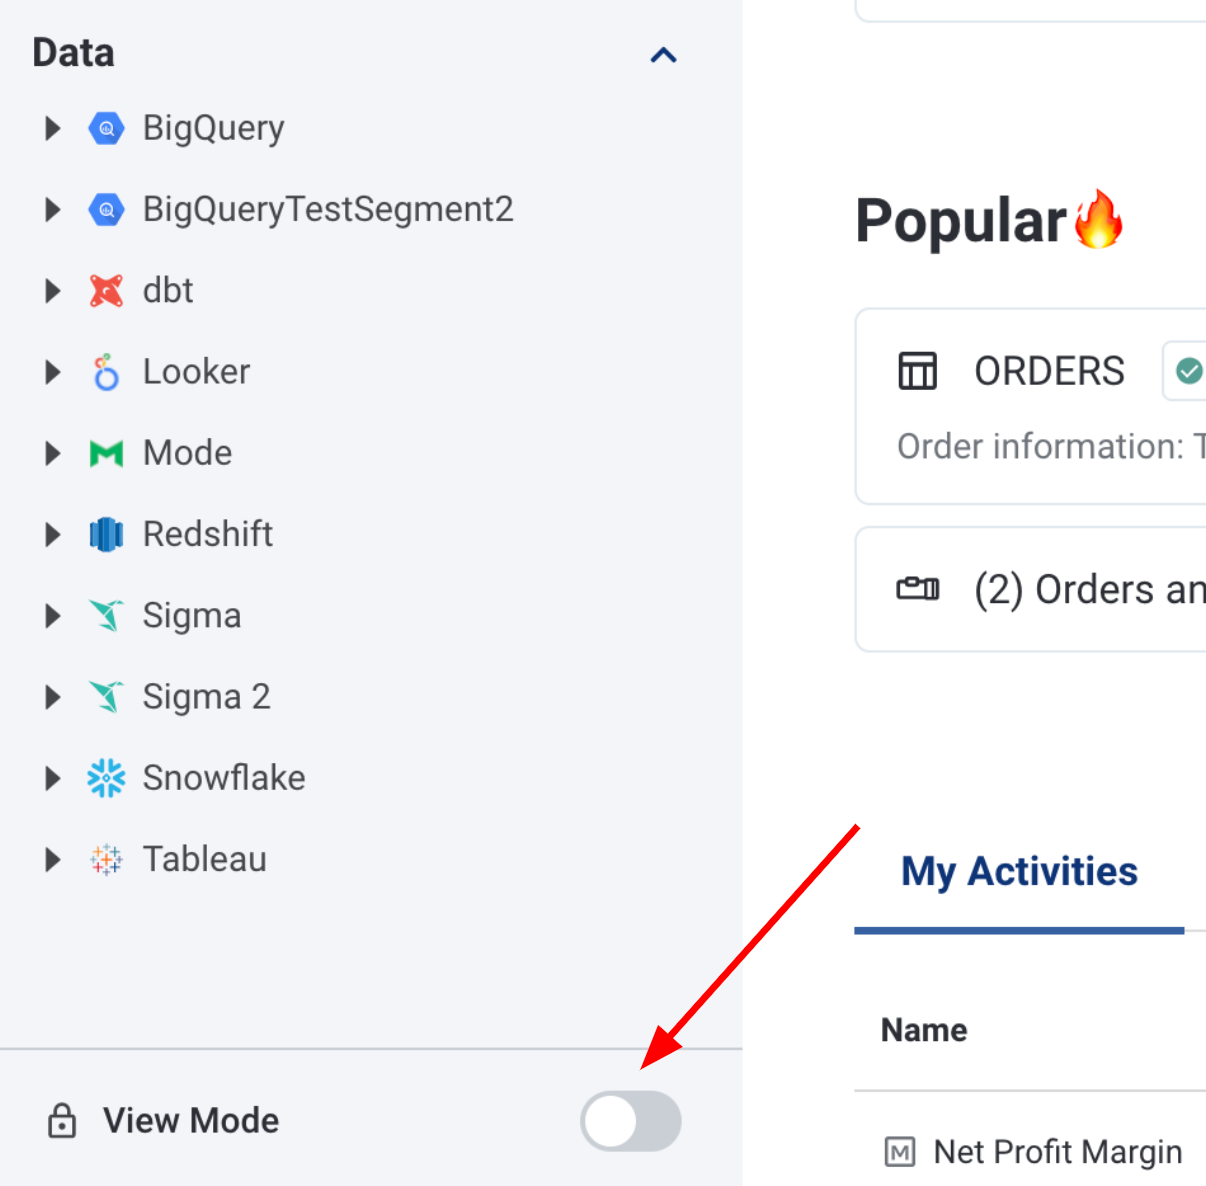
By turning it on and dragging your tag or doc around, you can nest them or reorder them as you want:
And yes, you can create as many levels as you want.
We're continuing to improve the experience, but if you have trouble nesting the docs, try hovering on the right side of the item. It should show an overlay:

If you want to reorder the items it should show a line:
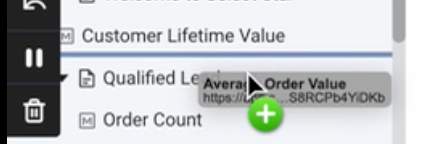
Make sure you turn off the Edit Mode so you're not changing the hierarchy by mistake 🙂
Discussion Counts We now show count of discussion items on table / dashboard / metric pages so you can see if anyone has left questions or comments in the past:
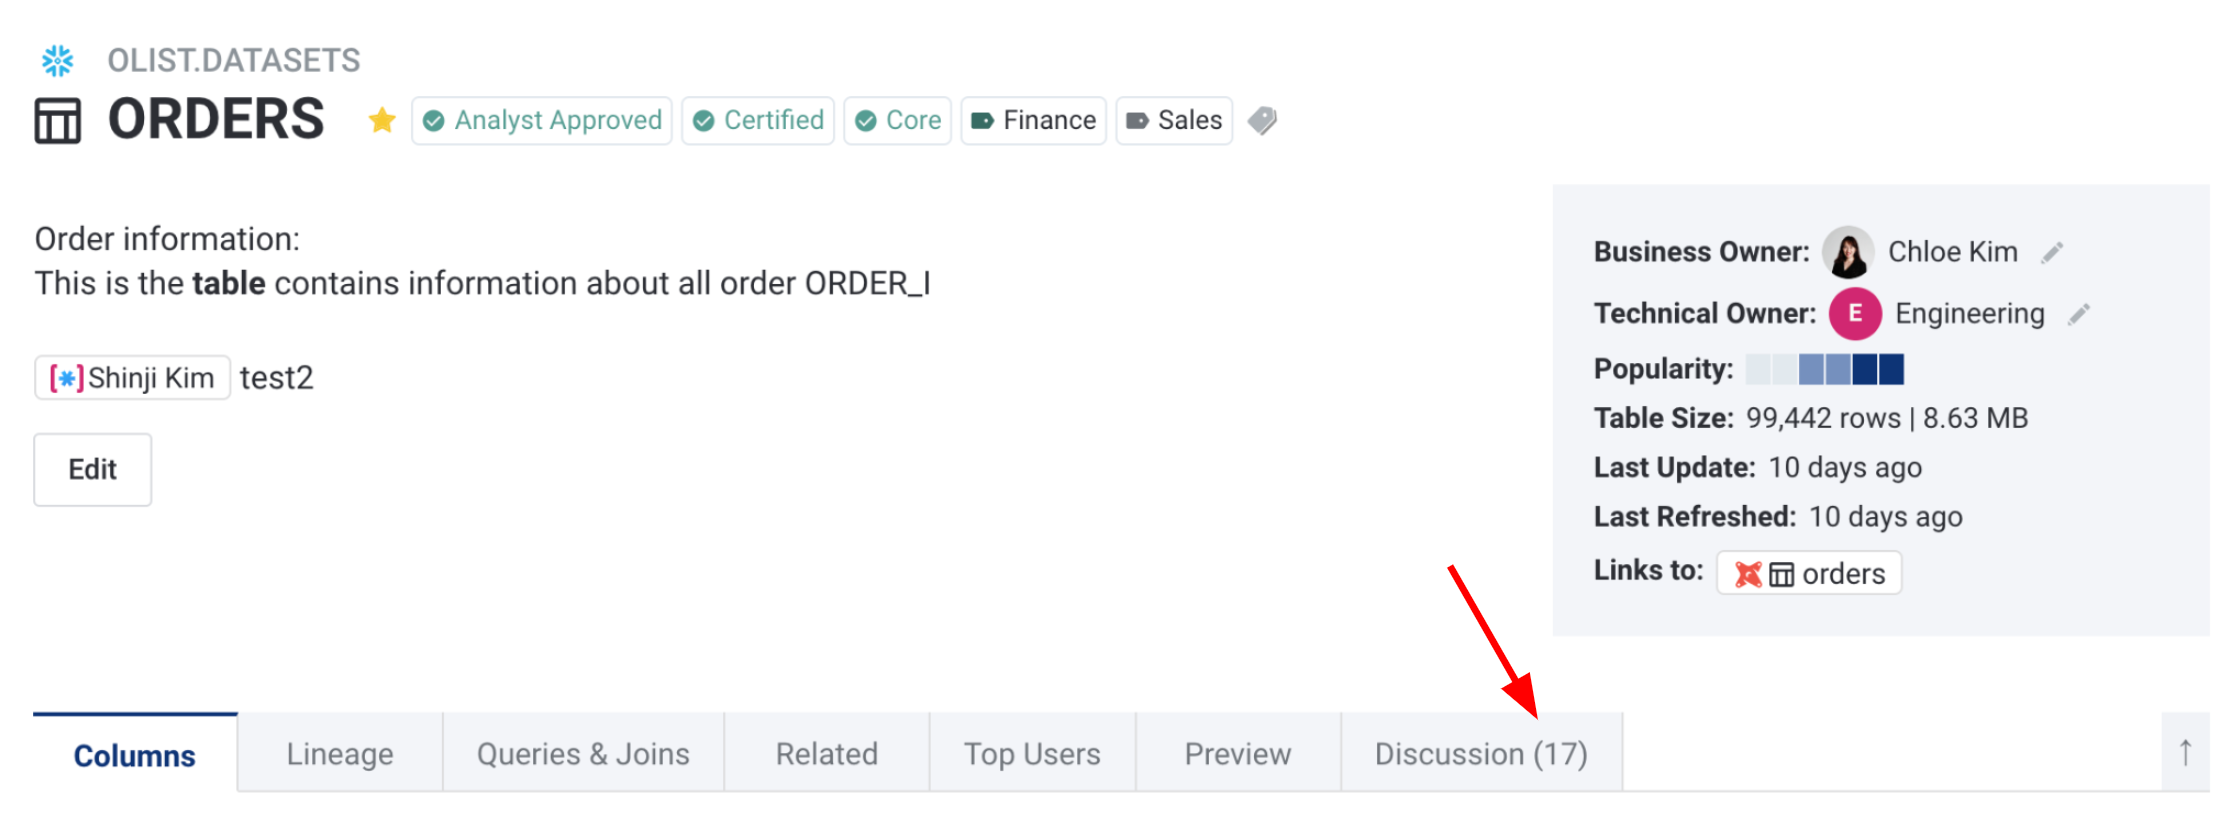
That's all - have a great rest of the week 🙌
April 21, 2022 - ✨ New Data Lineage Filters, Tableau/Looker Suggested Descriptions, and Metric Labels ✨
🔍 New Lineage Filters: Data Asset Type & 'Exclude' 🔍
You can now filter your data lineage by its Asset Type and 'Exclude':

This is useful if you have 100+ items on the list to sort through. You can now navigate your data lineage more easily with the ability to exclude results that includes "TEMP", "test", etc.
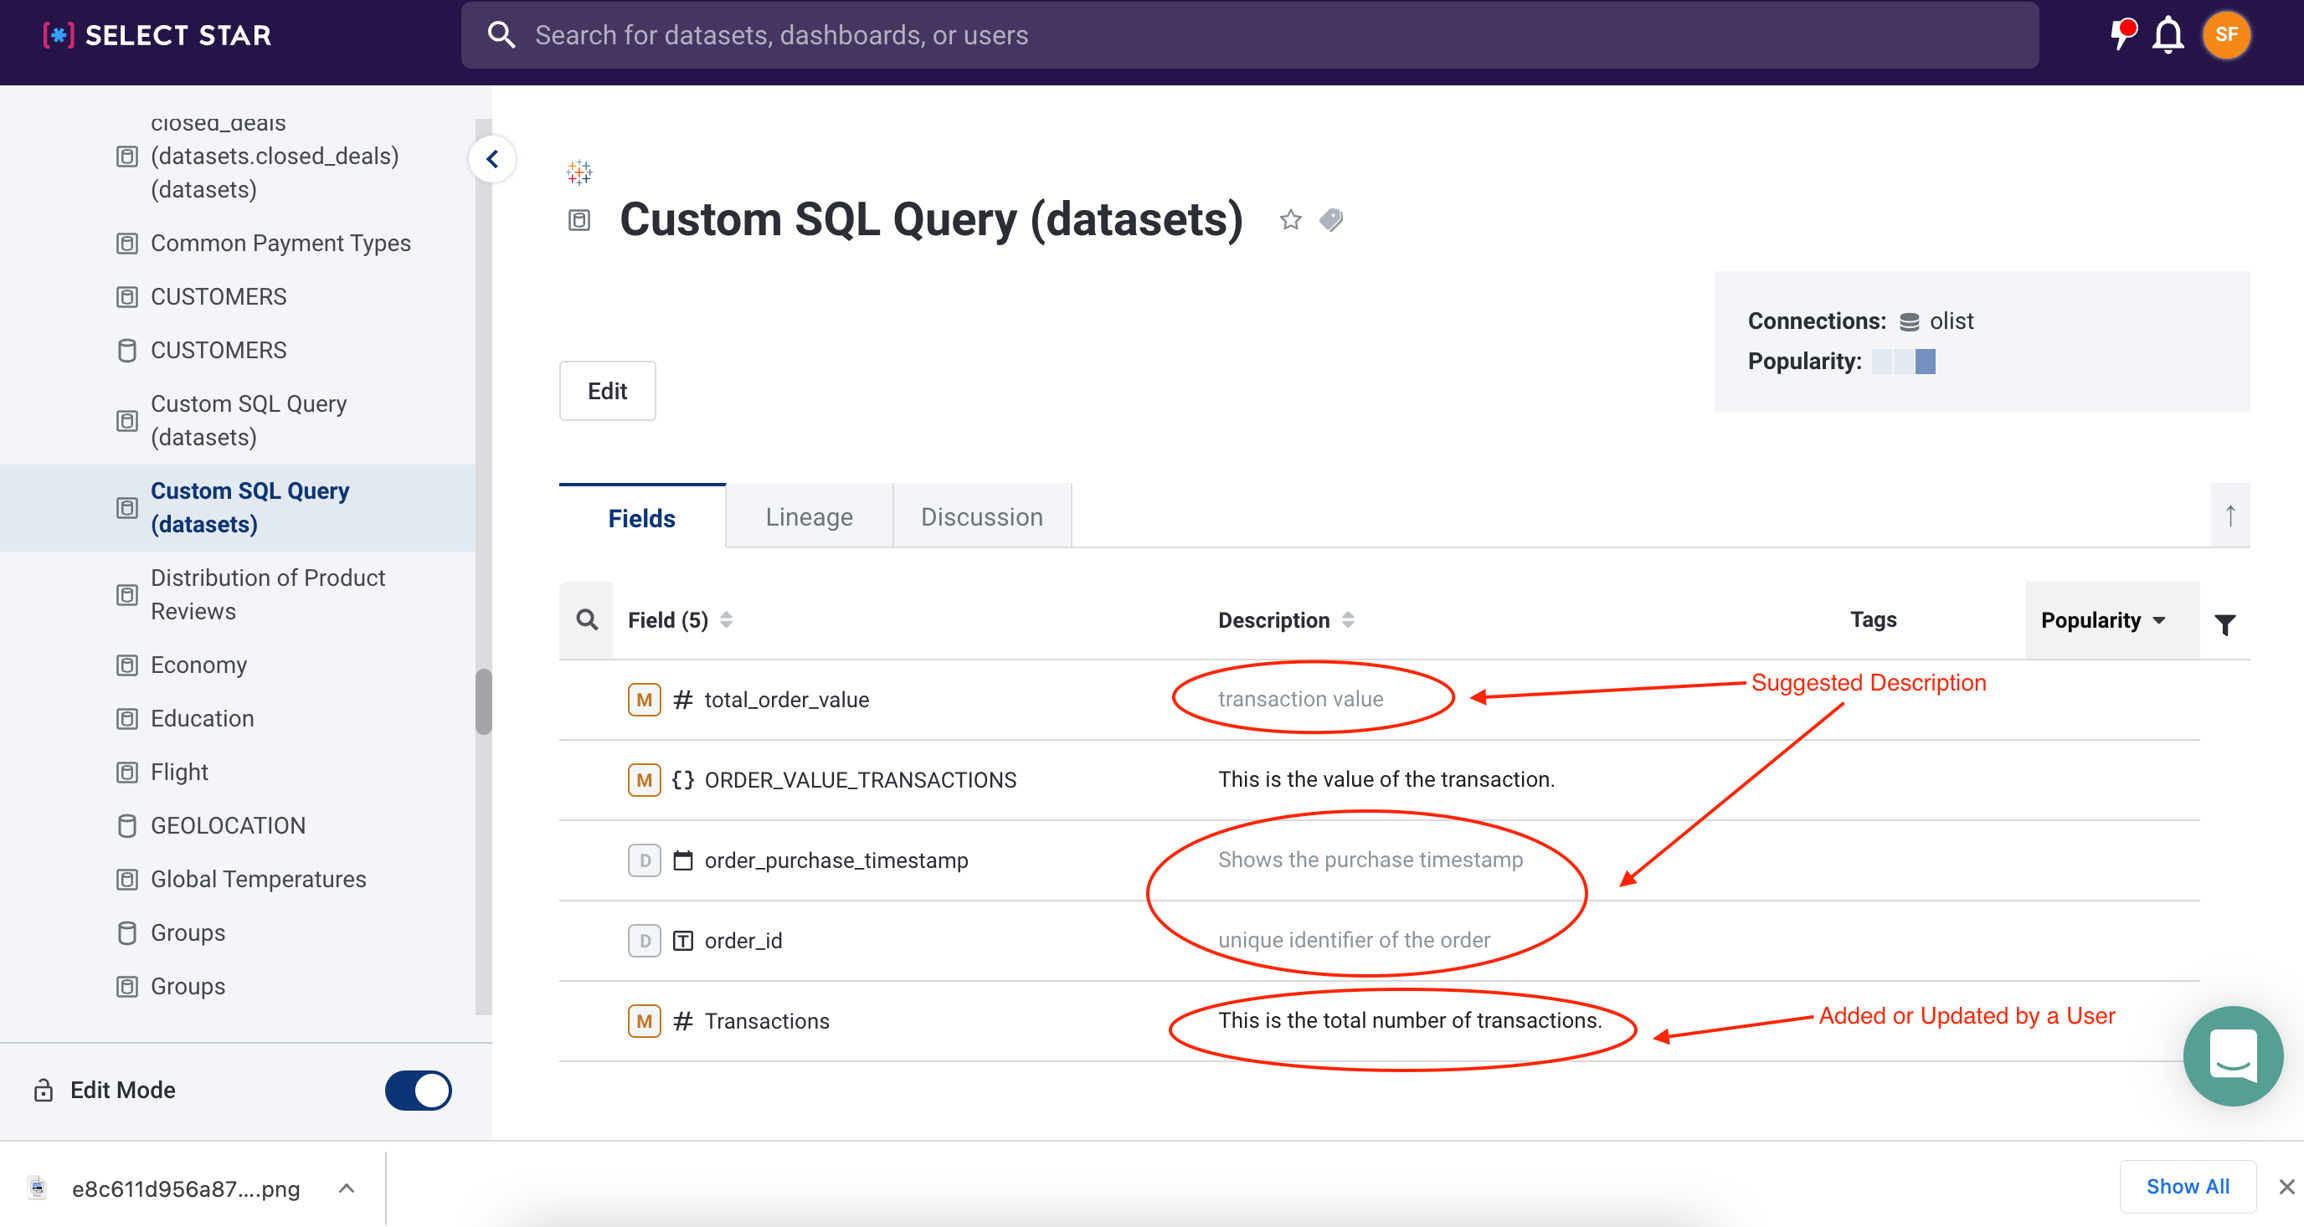
🪄 Suggested Descriptions for Looker and Tableau 🪄
For those of you with Looker and Tableau integrations, suggested descriptions will now be displayed when there are similar and upstream/downstream fields where the data has been inherited directly.
And of course, to quickly differentiate the Suggested Descriptions from ones added by your team, Suggested Descriptions will display in gray text until they are user-modified and saved:
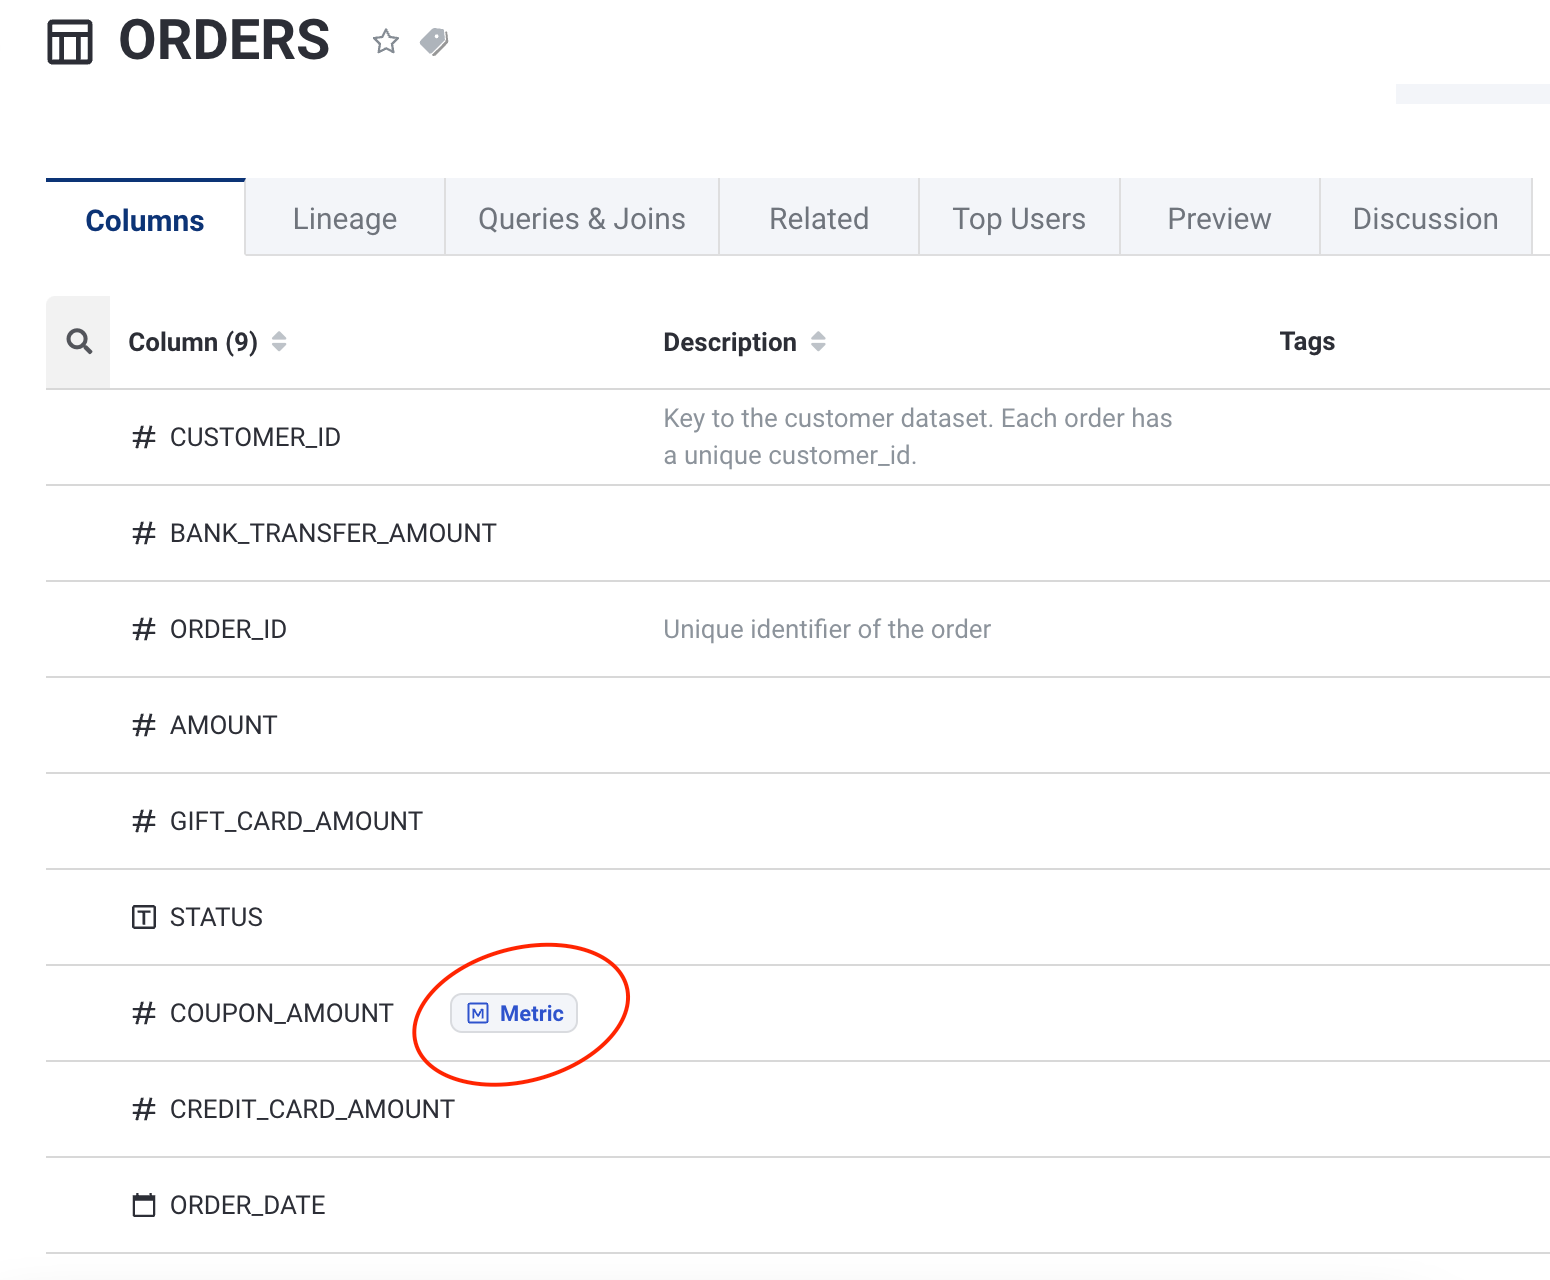
🎉 Metric label now available in columns! 🎉
You can now see when a column is associated with a Metric:
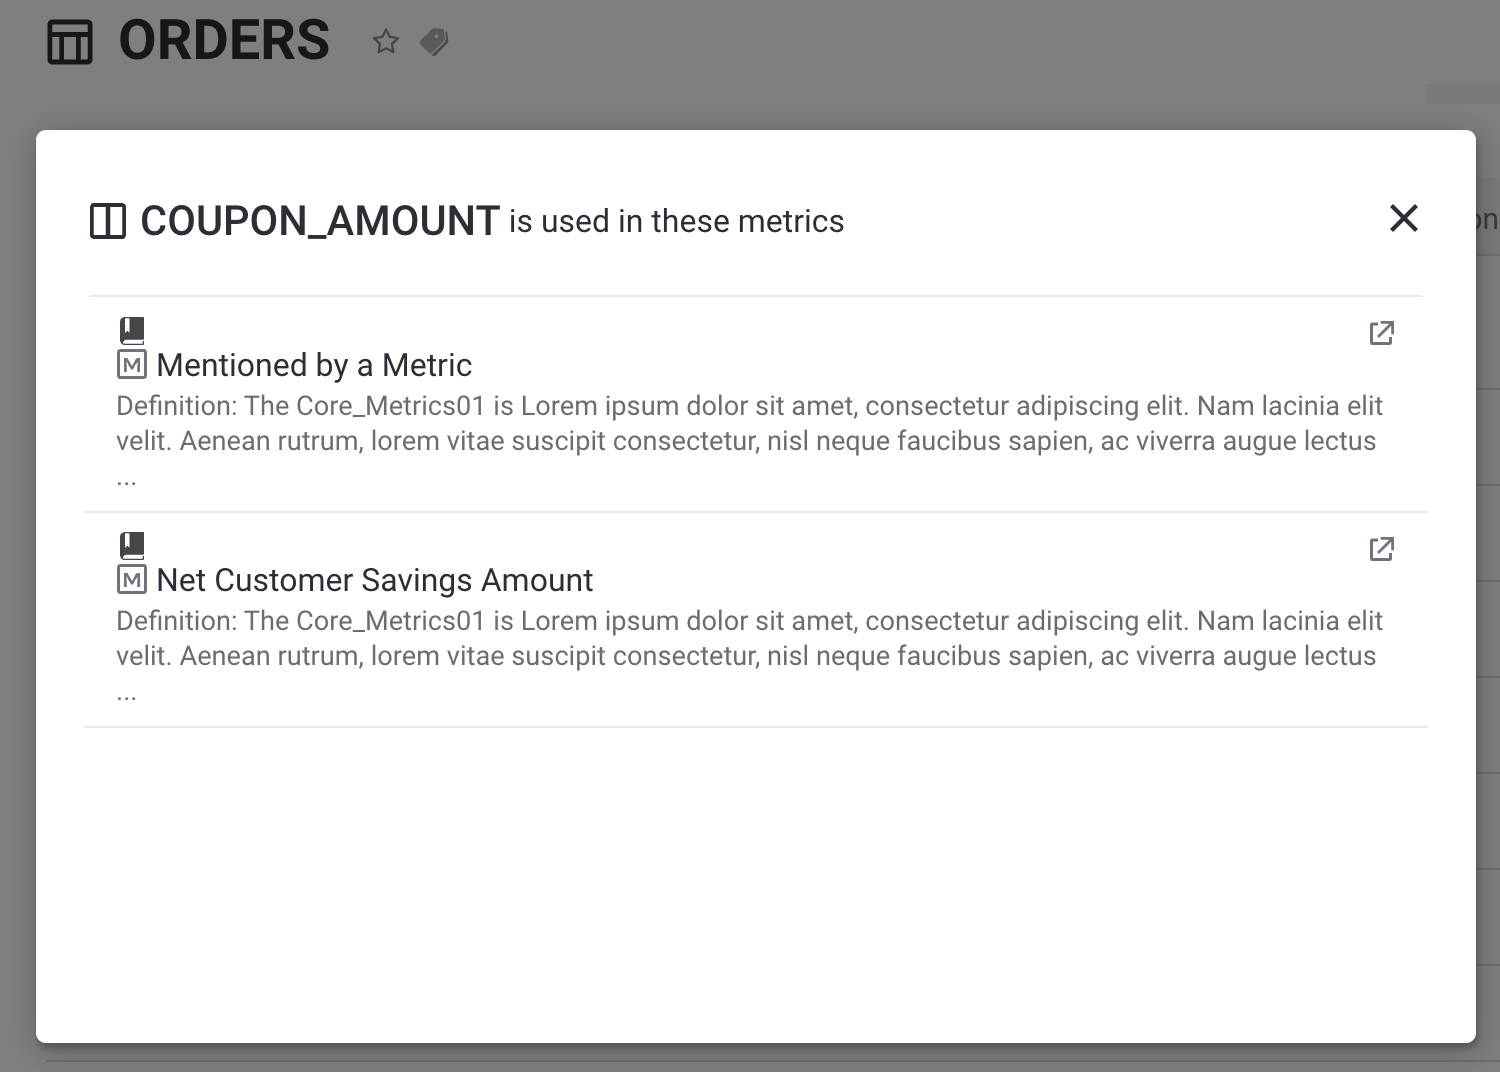
Similar to "Mentioned", but this will show all the Metrics when the column represents a metric:
April 14, 2022 - Enhanced Support for dbt & Slack 💬
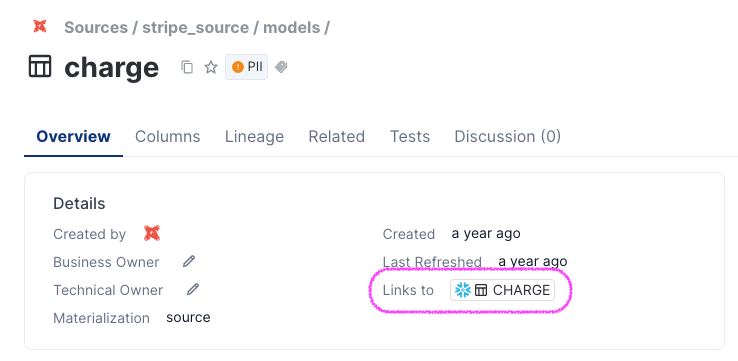
✨ Enhanced Support for dbt - Data Lineage & Links to Tables✨
You can now explore your data lineage by filtering down to include only your dbt sources, or by seeing how your dbt models and database tables interact together:

You can quickly flip back and forth between your dbt tables, views, and models, and your database tables by using the new 'Links to' feature:
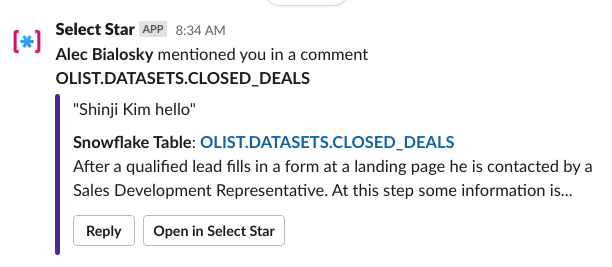
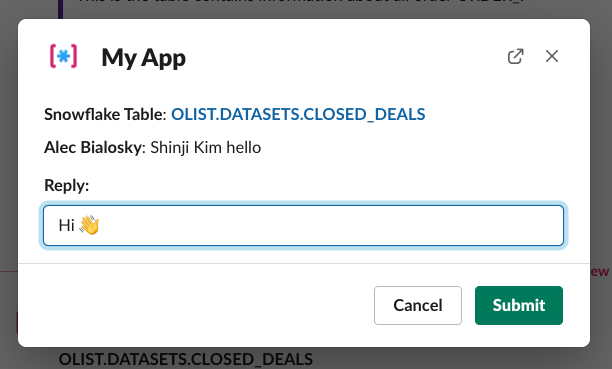
💬 Reply on comments directly on Slack 💬
Reply on discussion items right from Slack by clicking Reply button:
April 12, 2022 - 🎉 Introducing Sigma Integration!
🎉 Sigma BI Integration 🎉
We are thrilled to announce our latest BI integration with Sigma Computing 🥳
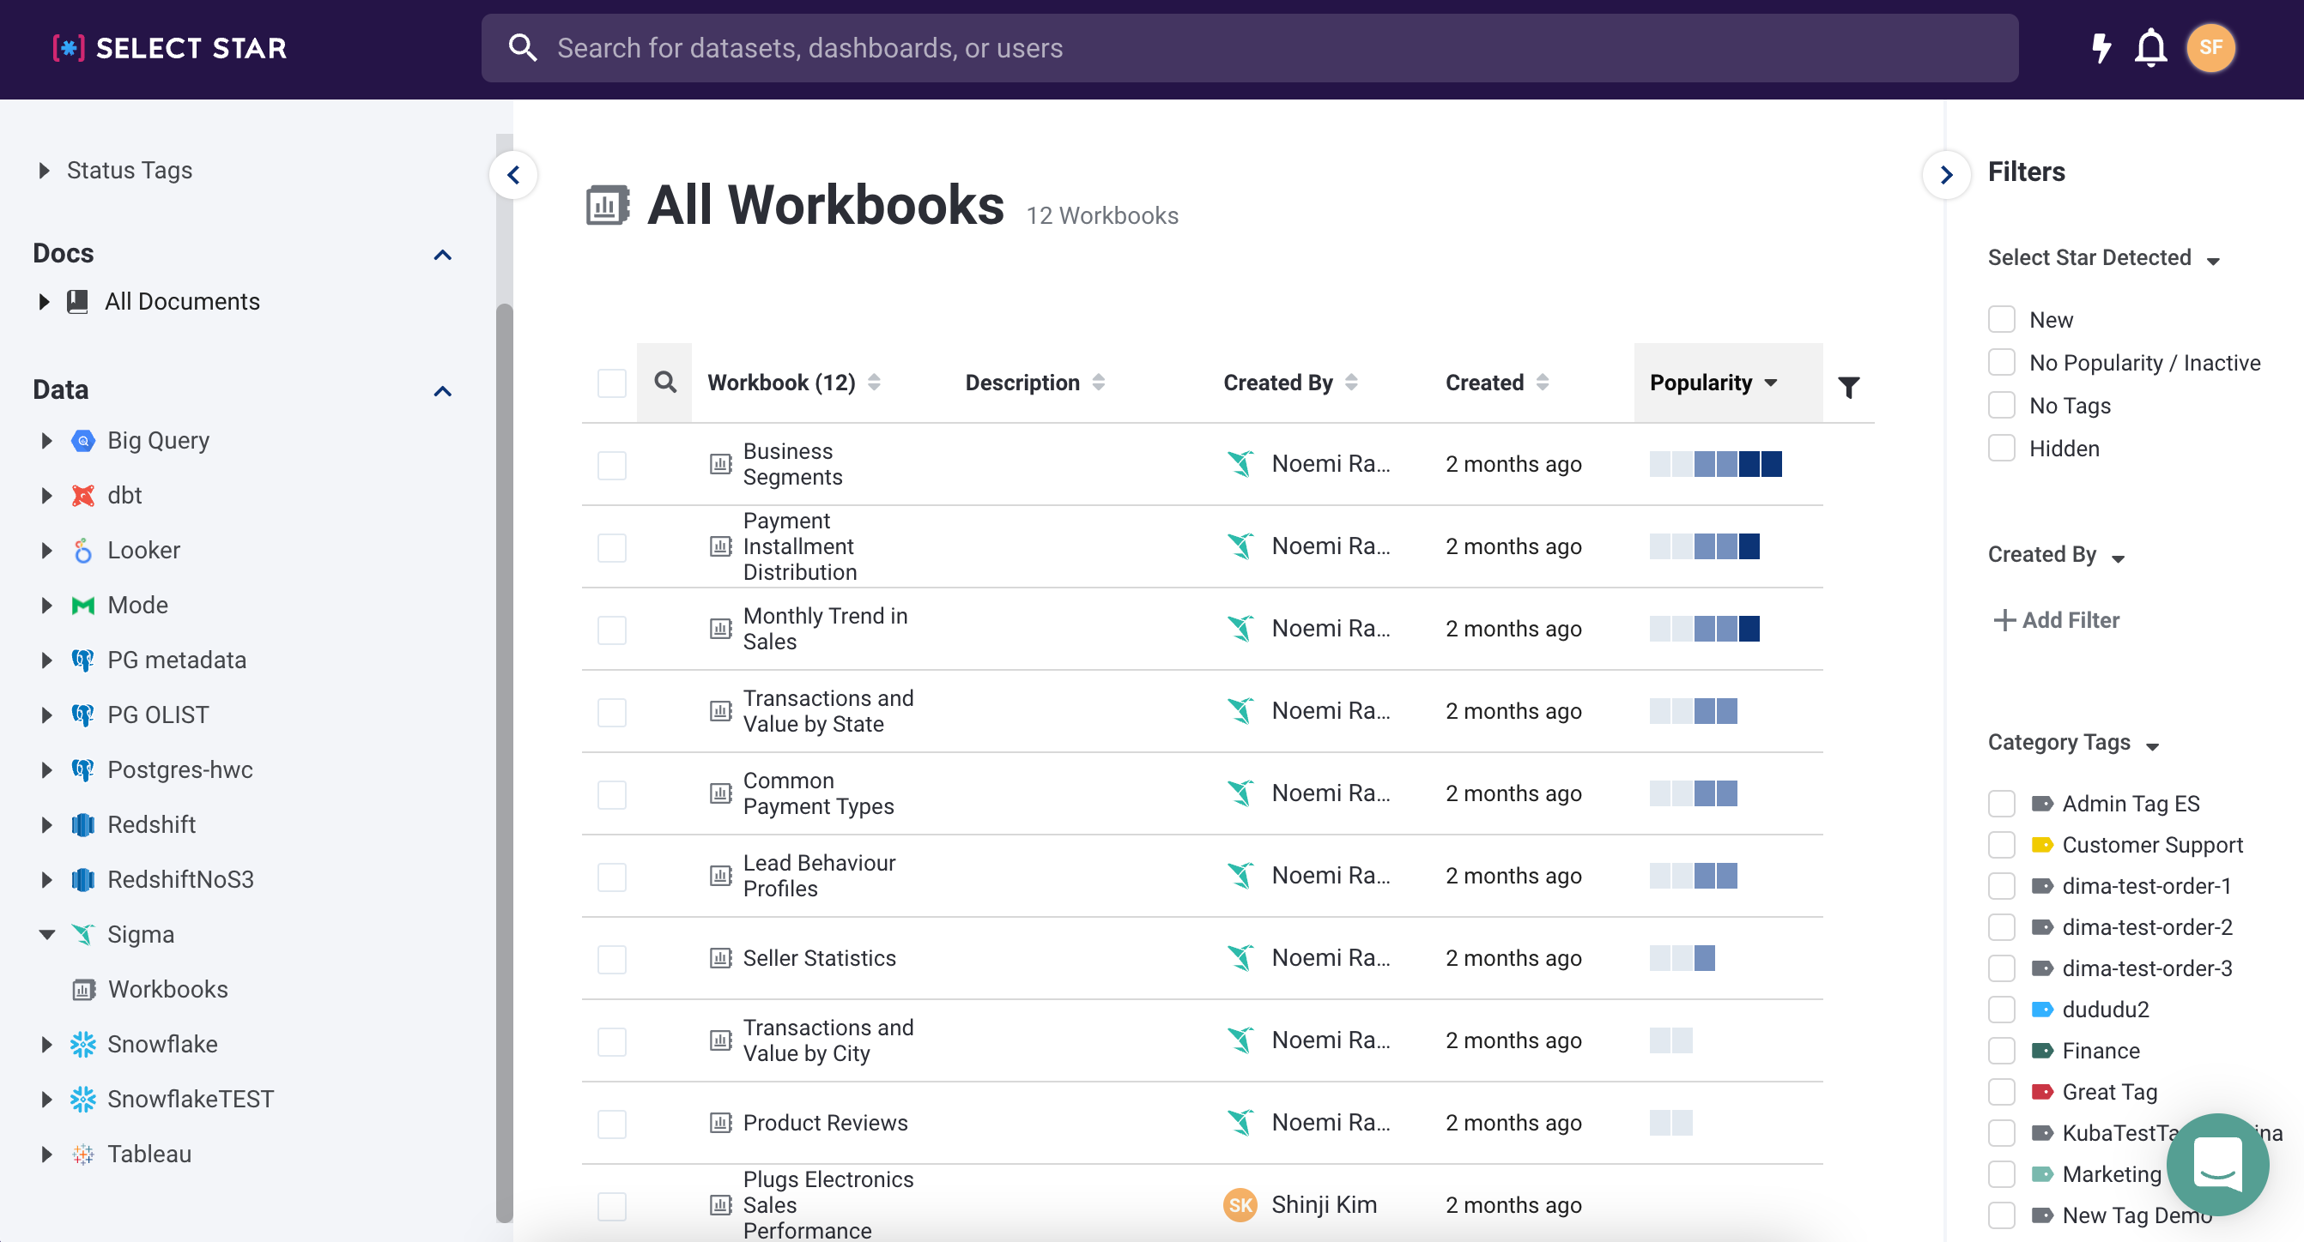
Users with Admin permissions can follow our instructions to connect your Sigma instance from your Select Star settings.
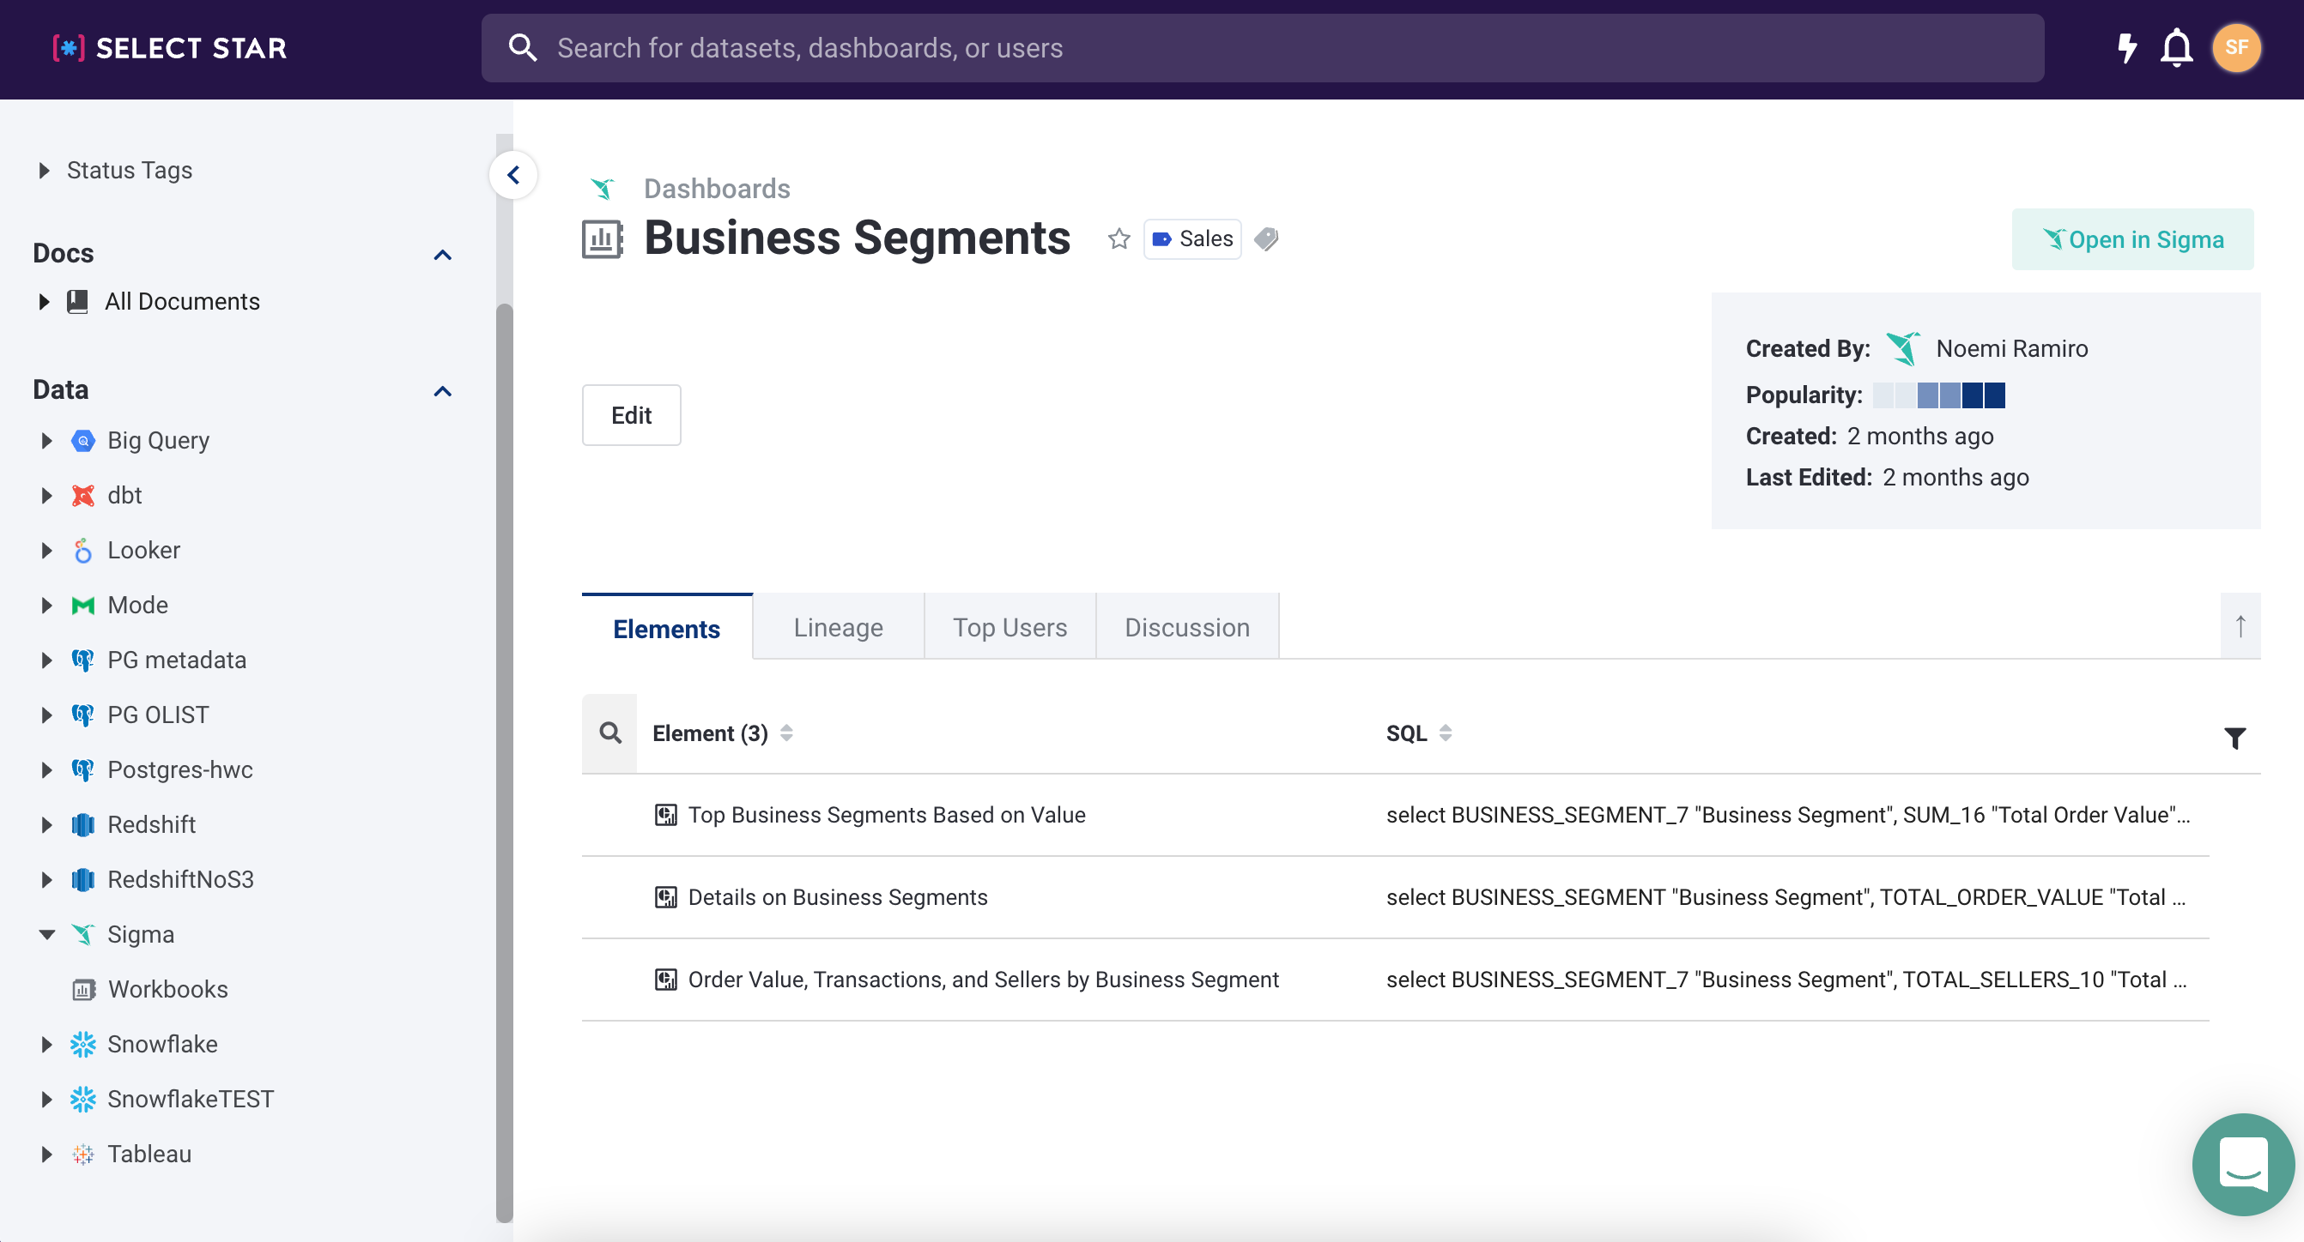
Once connected, you'll be able to see your BI workbooks' data lineage, popularity, and more!

April 1, 2022 - 💫 API Updates, Column Mentions & dbt File Folder Structure
✨ New API Endpoints—Update Metadata in Bulk & Get BI Dashboards ✨
You can now make bulk updates to descriptions via the API! Using the metadata_bulk_update endpoint, you can programmatically update descriptions on tables, columns, BI dashboards, Looker Explores, Tableau Data Sources, and dbt models.
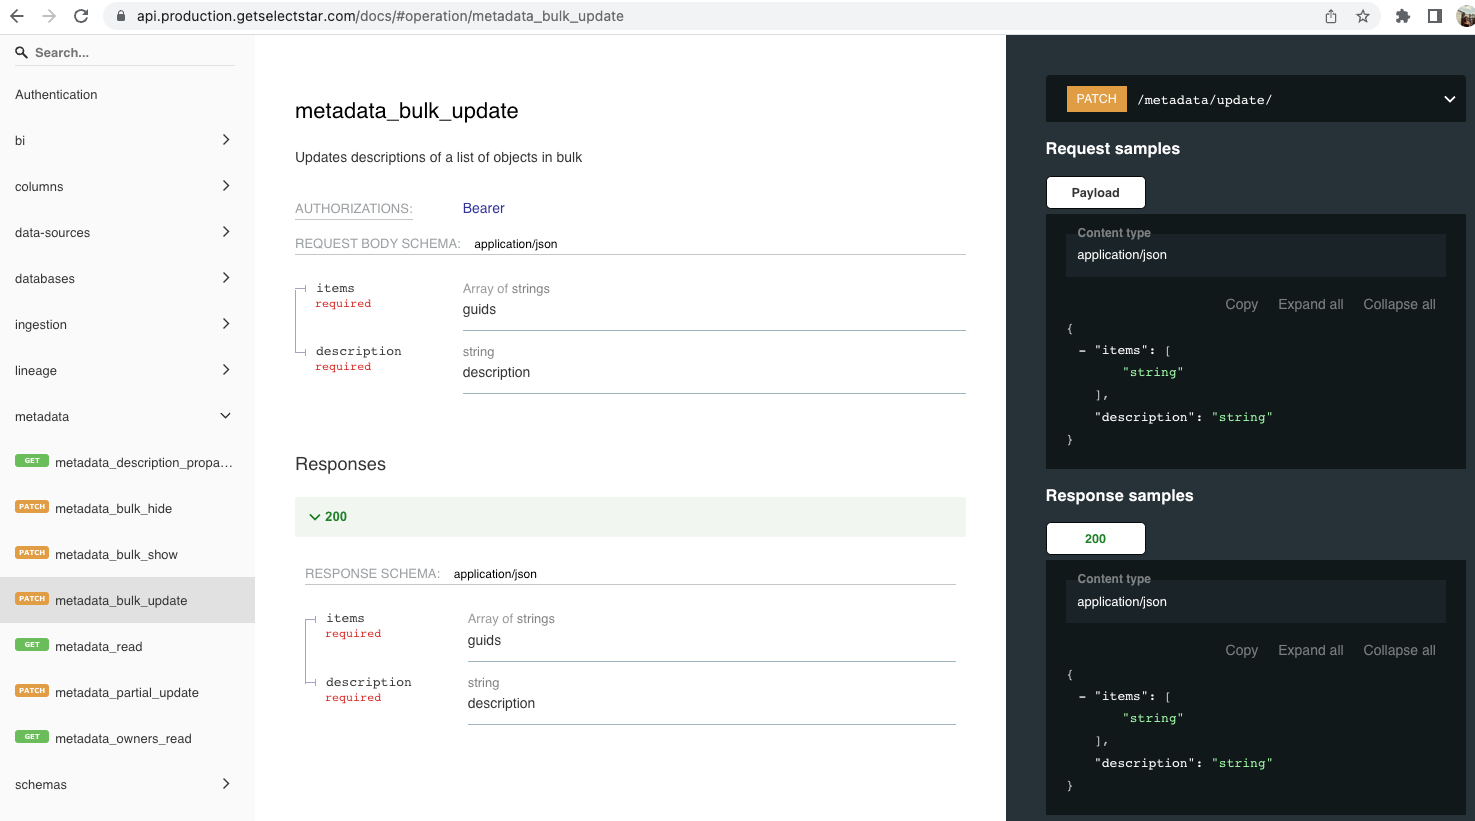
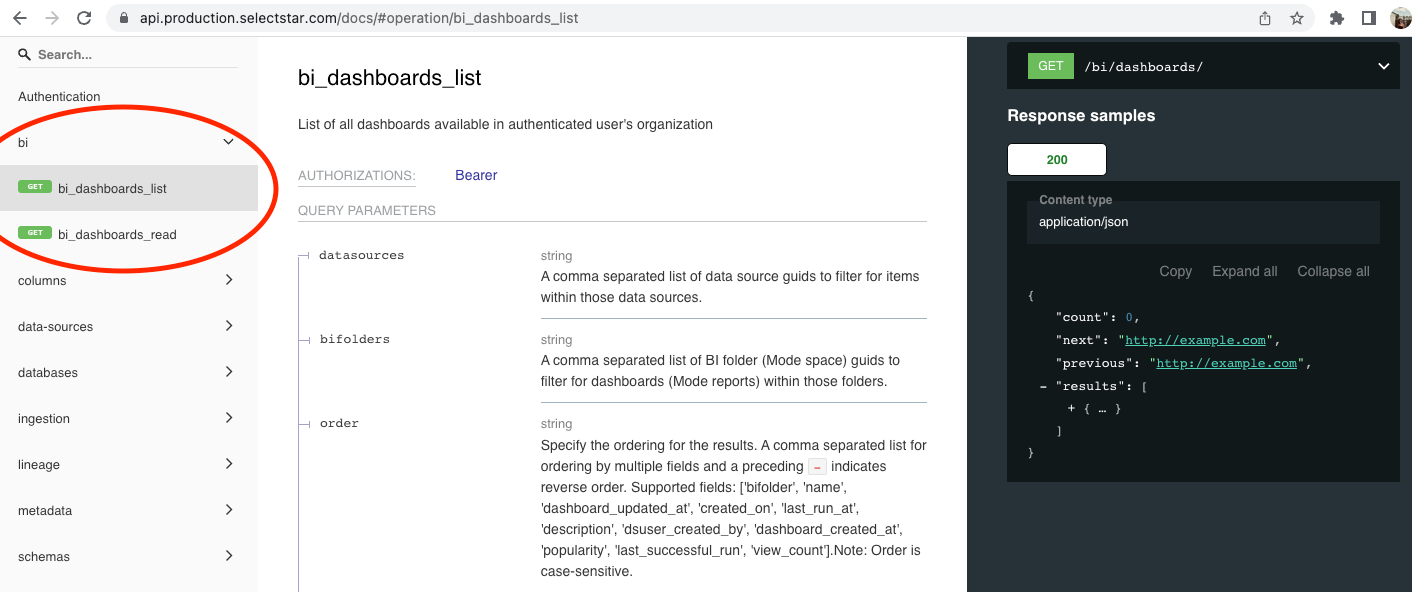
You can also retrieve information about your BI dashboards, including their popularity scores, tags, and top users, using the bi_dashboards_list and bi_dashboards_read endpoints 👇
🎉 See where your columns are mentioned 🎉
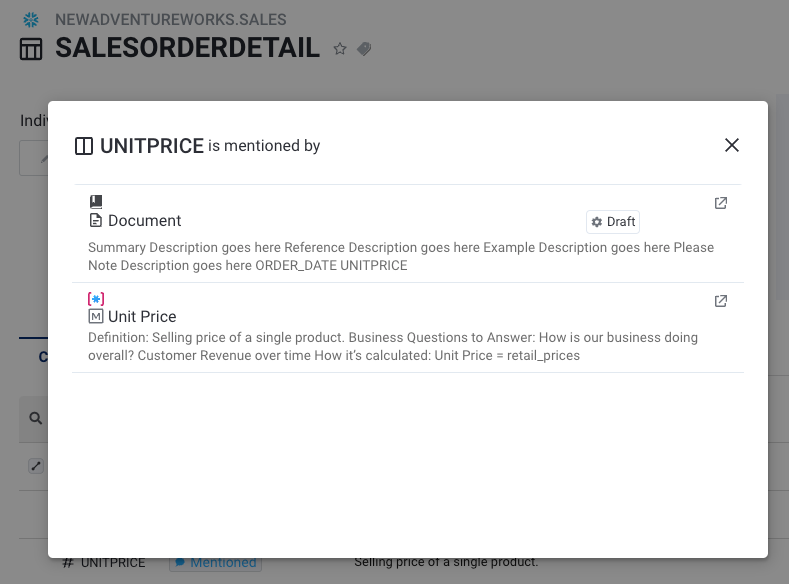
Mentions are now displayed at the column level! This means when a column is mentioned in a document or metric, you will see a "Mentioned" label on the table page.
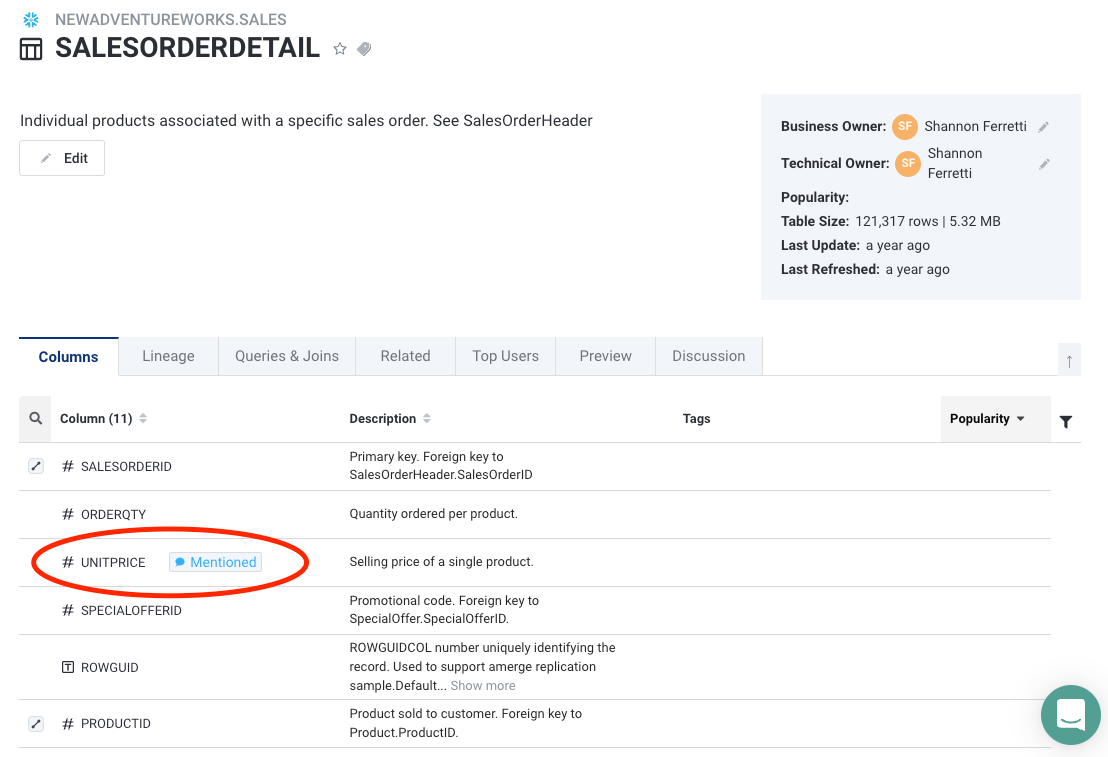
You can click on the "Mentioned" label to see everywhere the column is mentioned 👇
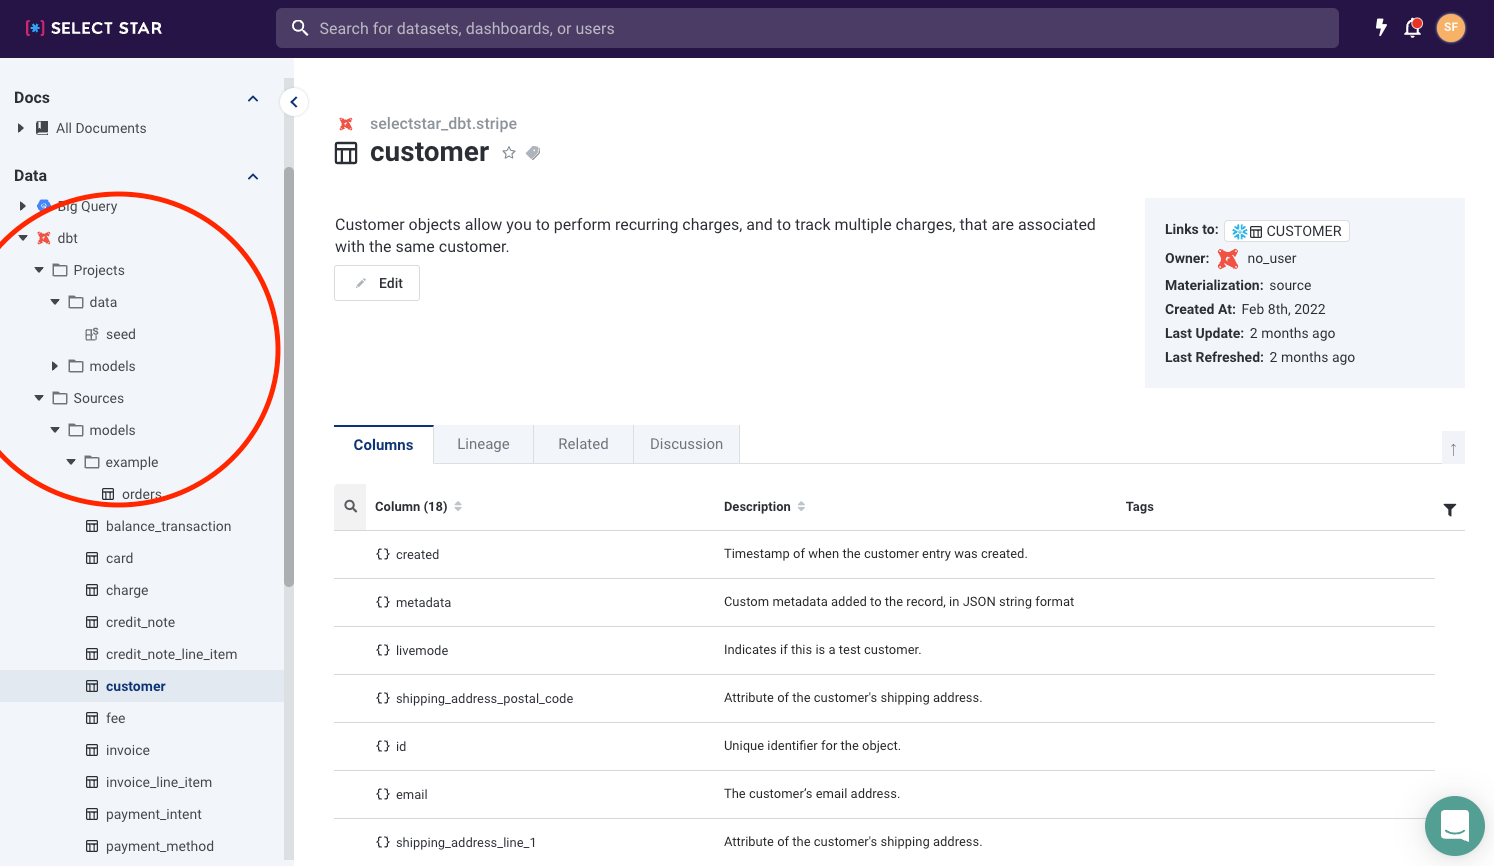
🪄 dbt Folder Hierarchy 🪄
You asked and we delivered. For those of you with dbt integrations, you’ll now see your dbt file folder structure in the left nav instead of the database hierarchy.
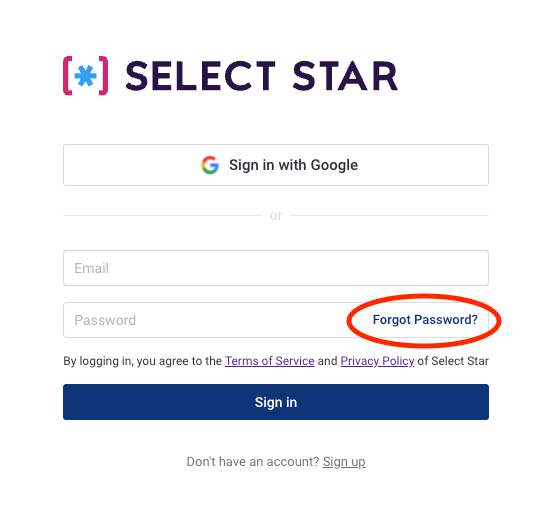
🐛 Forgot Password Bug Fix 🐛
Recently we ran into a bug that prevented users from using the Forgot Password feature on login. This has now been fixed!
March 22, 2022 - ✨ Improving Lineage & Docs Experience
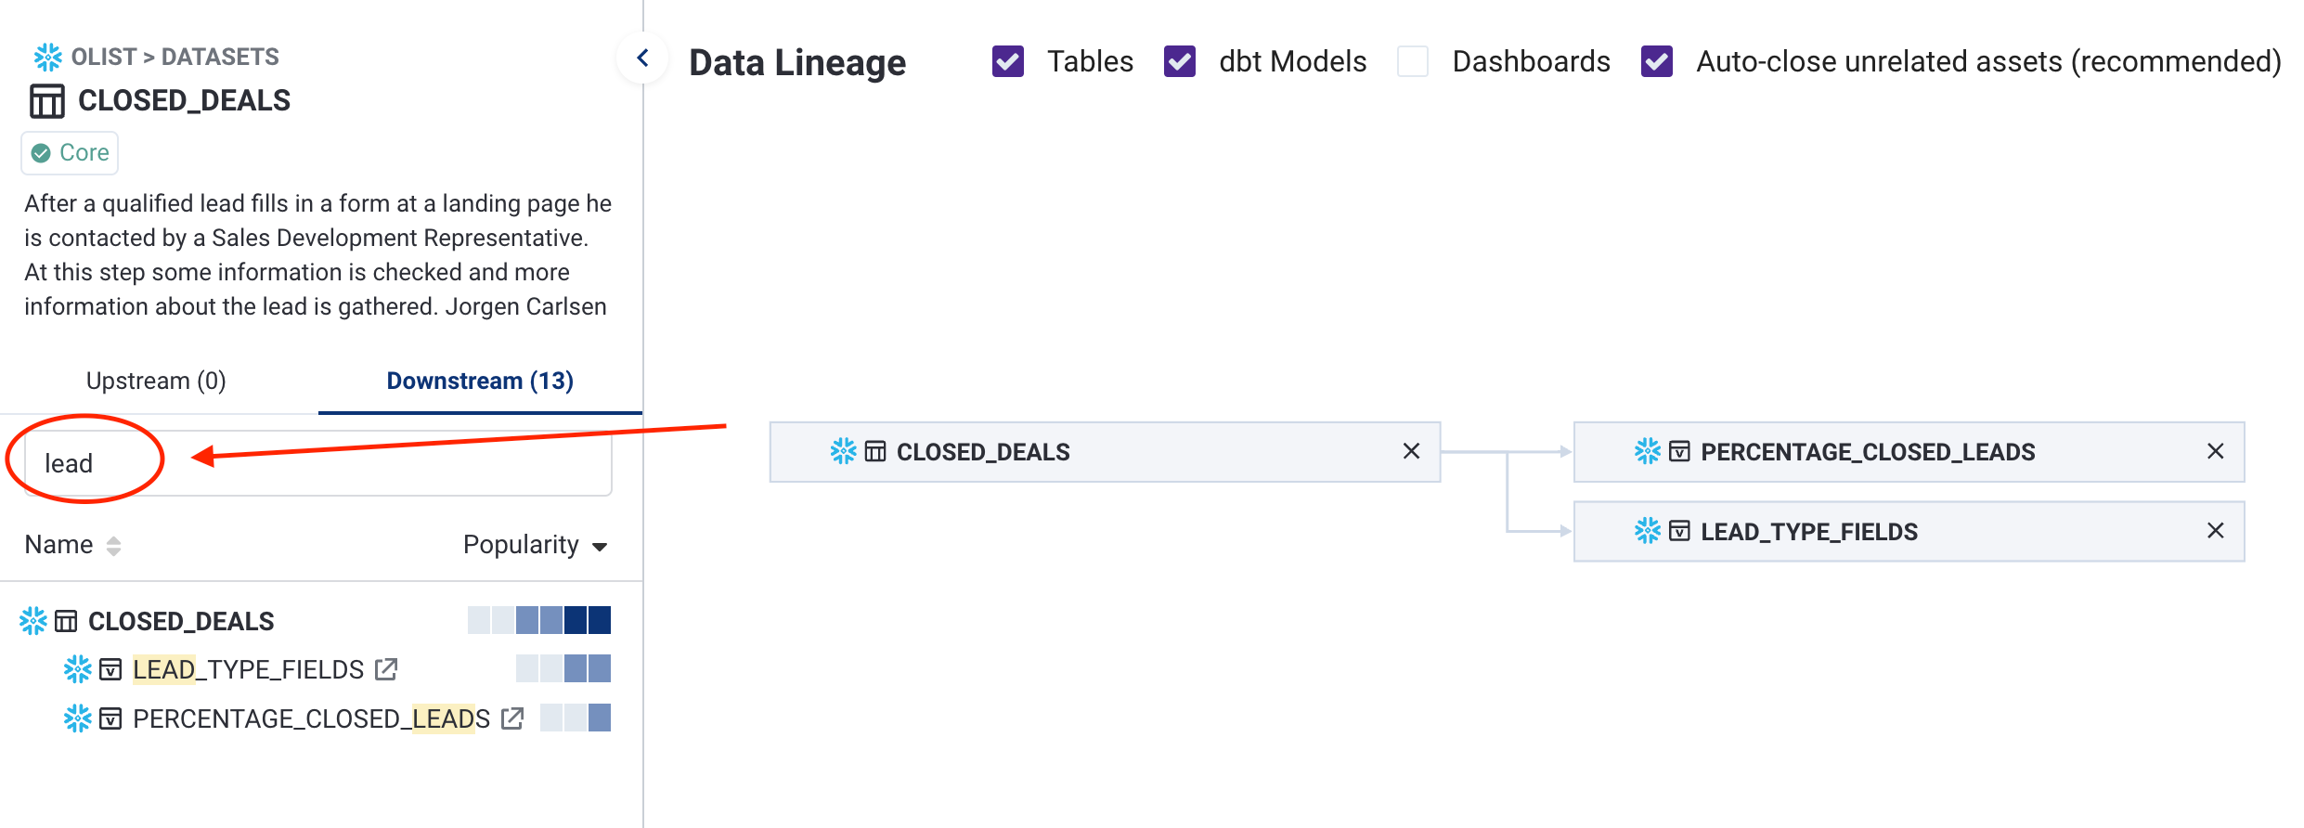
🔍 Lineage Search Filter 🔍
We know data lineage can get messy and complex, and that's one of the reasons we've added lineage search filter in the explore view:
🪄 Custom SQL Query Support for Tableau 🪄
Tableau users can now see lineage derived from Custom SQL Queries:

Further Tableau support is on the way, to point out invalid Custom SQL Queries in Tableau Data Sources.
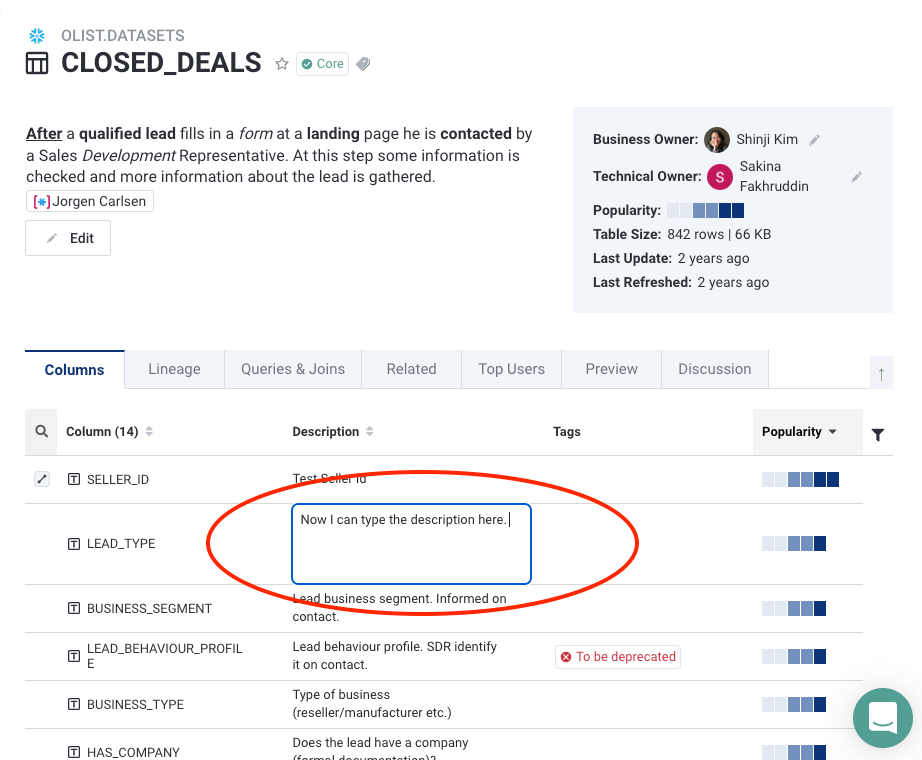
🐛 Safari - Column description edit bug fixed 🐛
We fixed a bug affecting Safari users adding column descriptions from the table page.
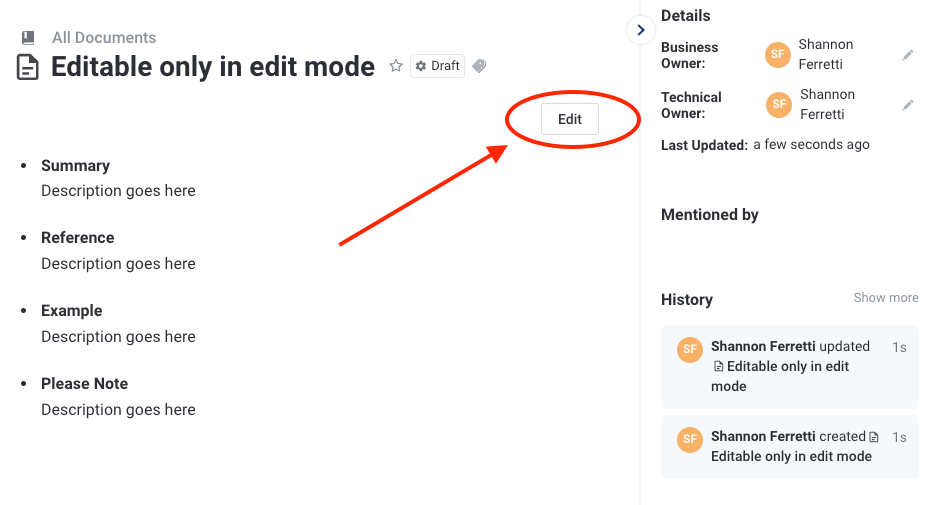
📝 Docs Edit Button 📝
We've added an 'edit' button for Documents. By default docs are displayed in a View mode, and no more accidental edits will be made to your documents.
March 18, 2022 - 🪄 Auto Documentation Update and Improved Filtering on Tables
✨ Auto Documentation Update: Table Docs & Public Docs ✨
You can now make edits to a table description and then propagate it to other similar tables, upstream and downstream lineage chain.
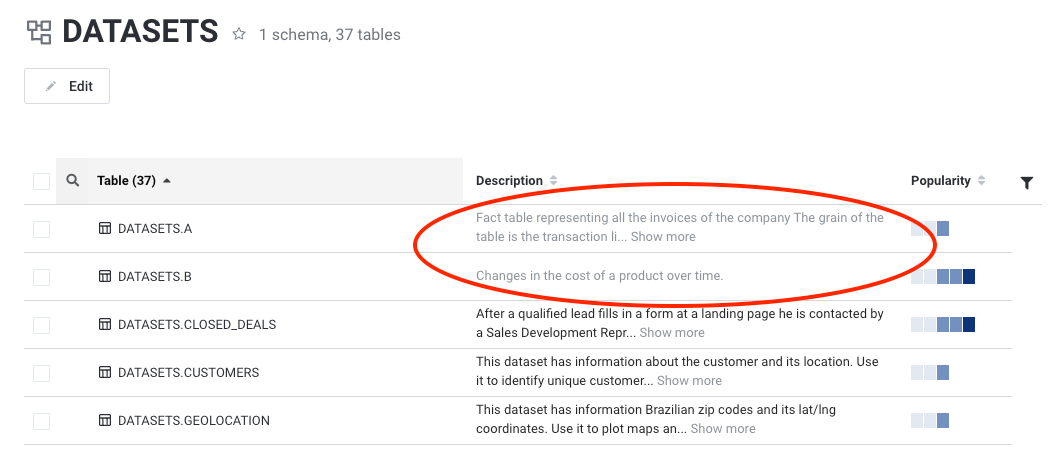
When using tables where public documentation is available, Select Star will now automatically load documentation for you. These descriptions are displayed in gray until someone in your organization makes an edit, and then they will display in black 👇
Read more about Auto Documentation here.
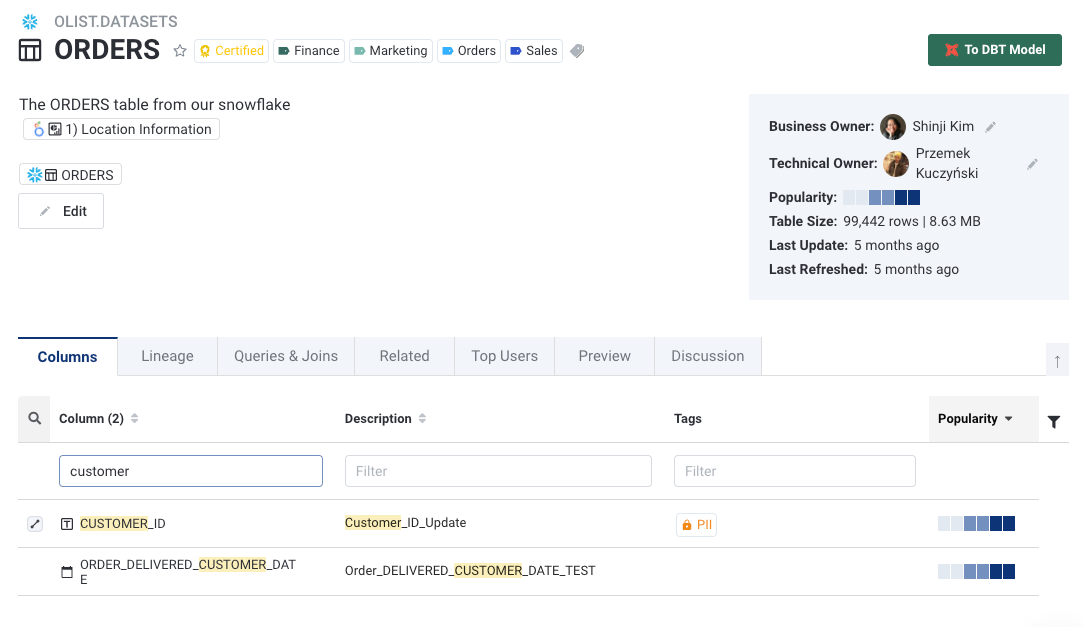
✨ One Filter to Search All Columns ✨
Searching for a keyword within a table will now return results found in any of the table columns. This means you don’t need to filter separately for column name vs. description columns anymore!
✨ Update BI Config in Admin ✨
You can now modify Looker, Mode, and Tableau configurations in admin👇
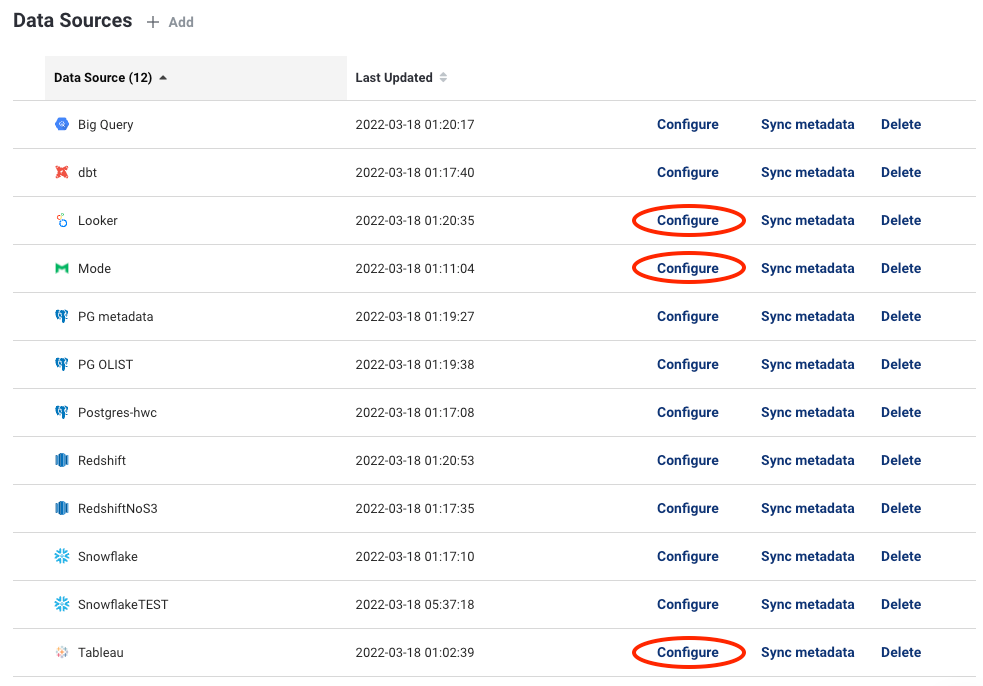
Use this to hide folders or collections from showing in Select Star:
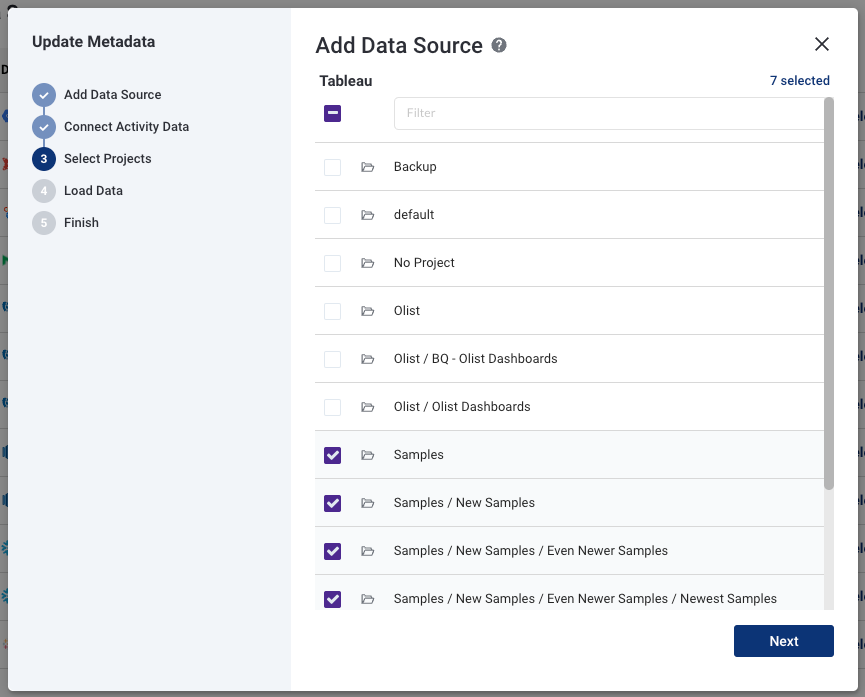
✨ Search Improvements and Fixes ✨
Ongoing upgrades and maintenance on search have been in the works, with further speed improvements and bug fixes now released.
March 2, 2022 - 🧙♂️ Auto Documentation (Beta)!
Documentation completeness is becoming increasingly important for many of our customers and today we're releasing 2 features that will help you achieve that goal.
Propagate column descriptions Utilizing lineage, we'll notify you if there are direct inheritance on column that uses the same data. So now you can update column description once, and propagate it to other similar columns, upstream and downstream lineage chain:
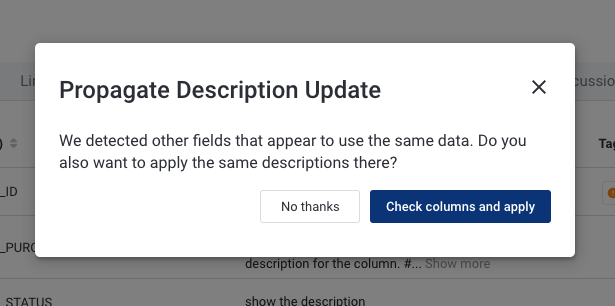
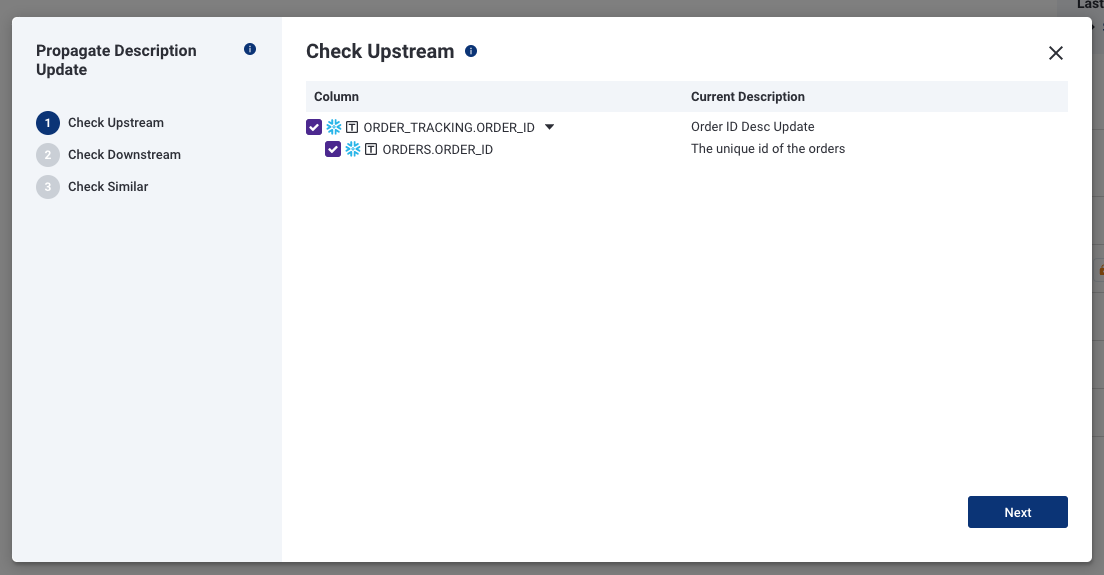
🧙♂️ Now you can write docs once, and update it everywhere. ✨
Suggested column descriptions
Propagating column descriptions is great when you're first writing documentation or adding descriptions, but what if you don't have any documentation to begin with? Or - what about existing column descriptions in other tables right now?
Starting today, Select Star will fill in column descriptions that match the following:
Similar columns (table structure is the same and we regard the table as a duplicate)
Upstream / downstream lineages
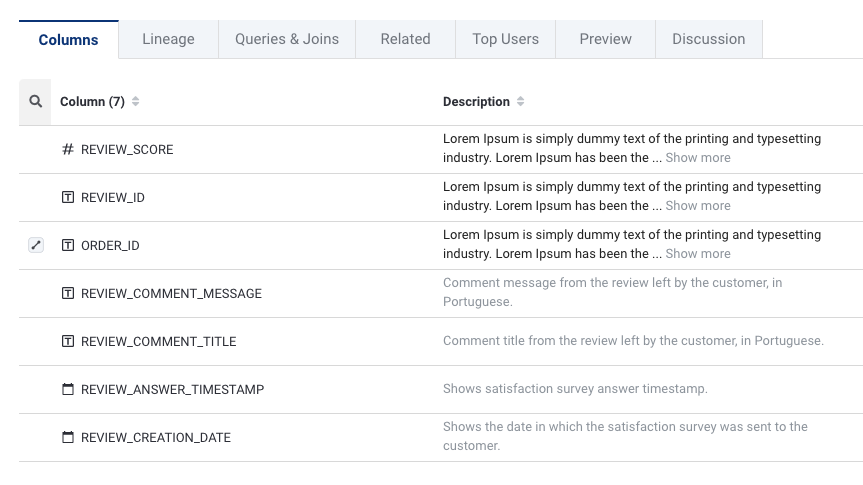
👆 User descriptions and loaded descriptions in black, and suggested descriptions are in gray.
Of course, you can always edit the description and hit enter to save and it will become your user description in Select Star.
We hope this makes your documentation journey much easier on Select Star. In the upcoming weeks we'll extend the feature to BI (Looker / Tableau) field descriptions too, so please stay tuned & let us know if you have any questions or feedback!
March 1, 2022 - ✨ Recently Viewed, Activity Sidebar, and Tags page
We have new improvements also added to Select Star today👇
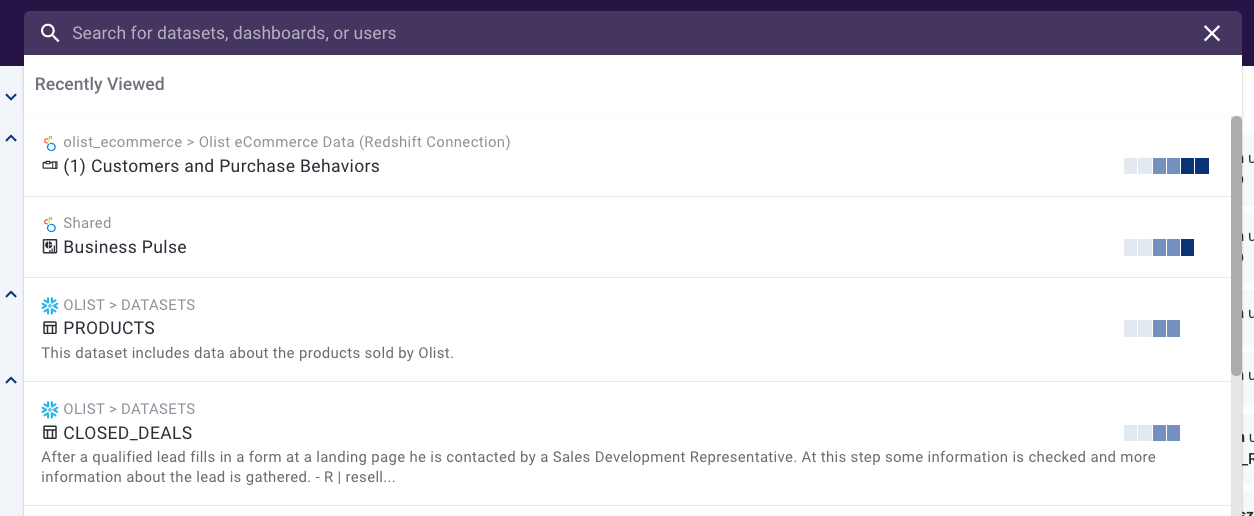
Recently Viewed: Now on your search result, you can see the most recent pages you've visited:
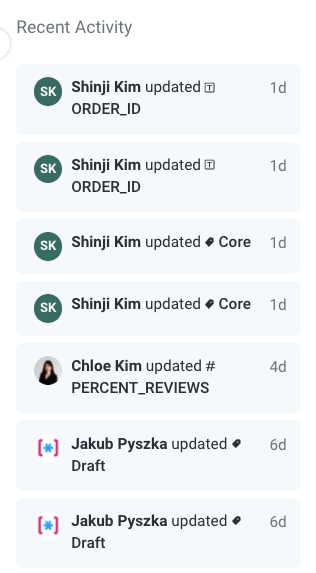
Activity Sidebar focused on user actions: In order to show what's happening around Select Star, now we show all the activities to be updates & comments:
Tags page for columns: When columns are displayed on tags page, you'll be able to see its inherited table tags together. This is convenient to organize your Category tags for tables and still keep status tags in different columns:

March 1, 2022 - 📝 Data Documentation
We're excited to share our latest feature - Docs! 🎉
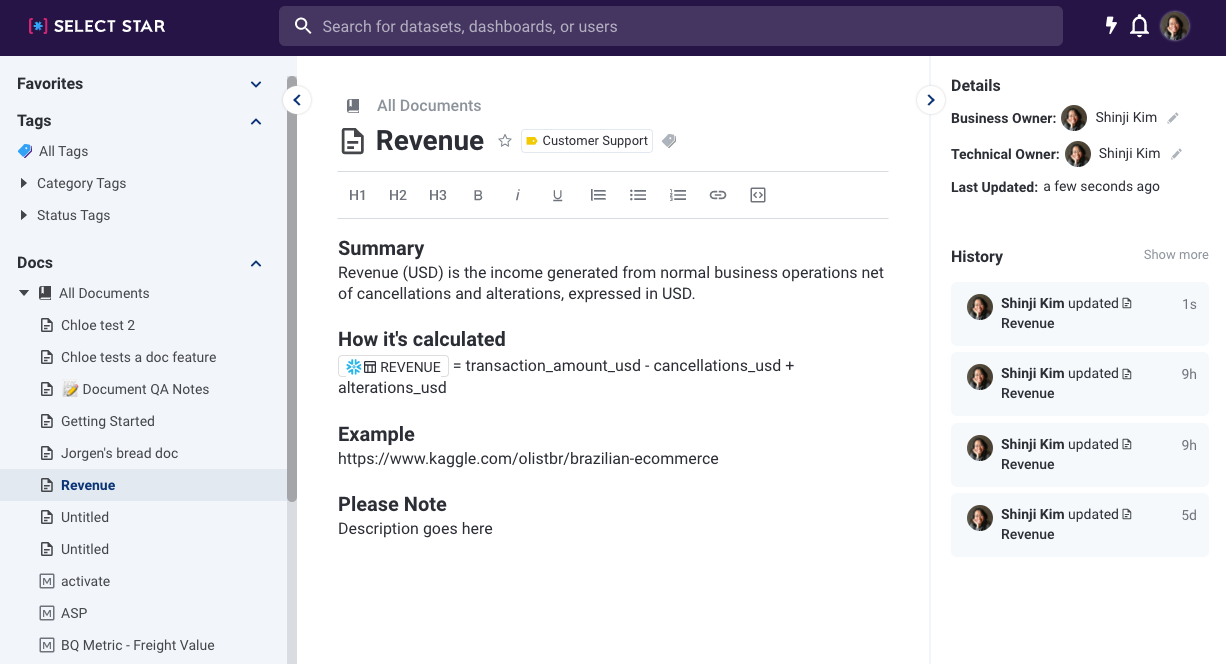
This allows you to create semantic-level documentation & business glossary terms that everyone can understand, whether they are familiar with your data warehouse or not.
You can mention tables, columns, and users and soon they will be linked to the table & column pages.
If you have metrics already, the current metric pages will be shown under All Documents.
We'll be iterating on this feature in the next few weeks, so try it out and let us know what you think!
February 2, 2022 - Lineage Update!
By popular demand, we're making our data lineage simpler and faster to use! Our first step to this is having a list view by default. When clicking on Lineage tab, instead of opening a popup window we'll show you the list of upstream & downstream objects. You can always go to Explore tab to open the graph modal if you want.
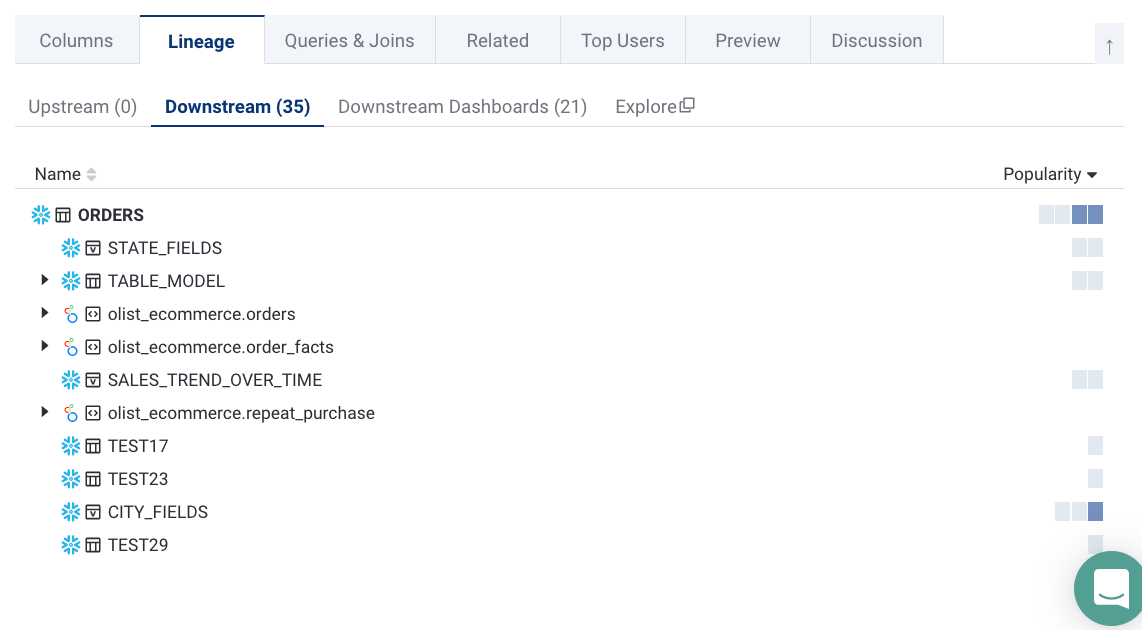
January 31, 2022 - 🥳 Column pages and lineage improvements all around
Here's a few features we've gotten a lot of requests for. Check them out and tell us what you think!
Columns page and column lineage
Smaller graphs for lineage click to focus feature
📄 Columns page and column lineage 📄
Columns have their own page and their own lineage. Click a column in a table to see the column page. From there, you can explore lineage that highlights where the column is used. You can also explore queries and joins that use this column.
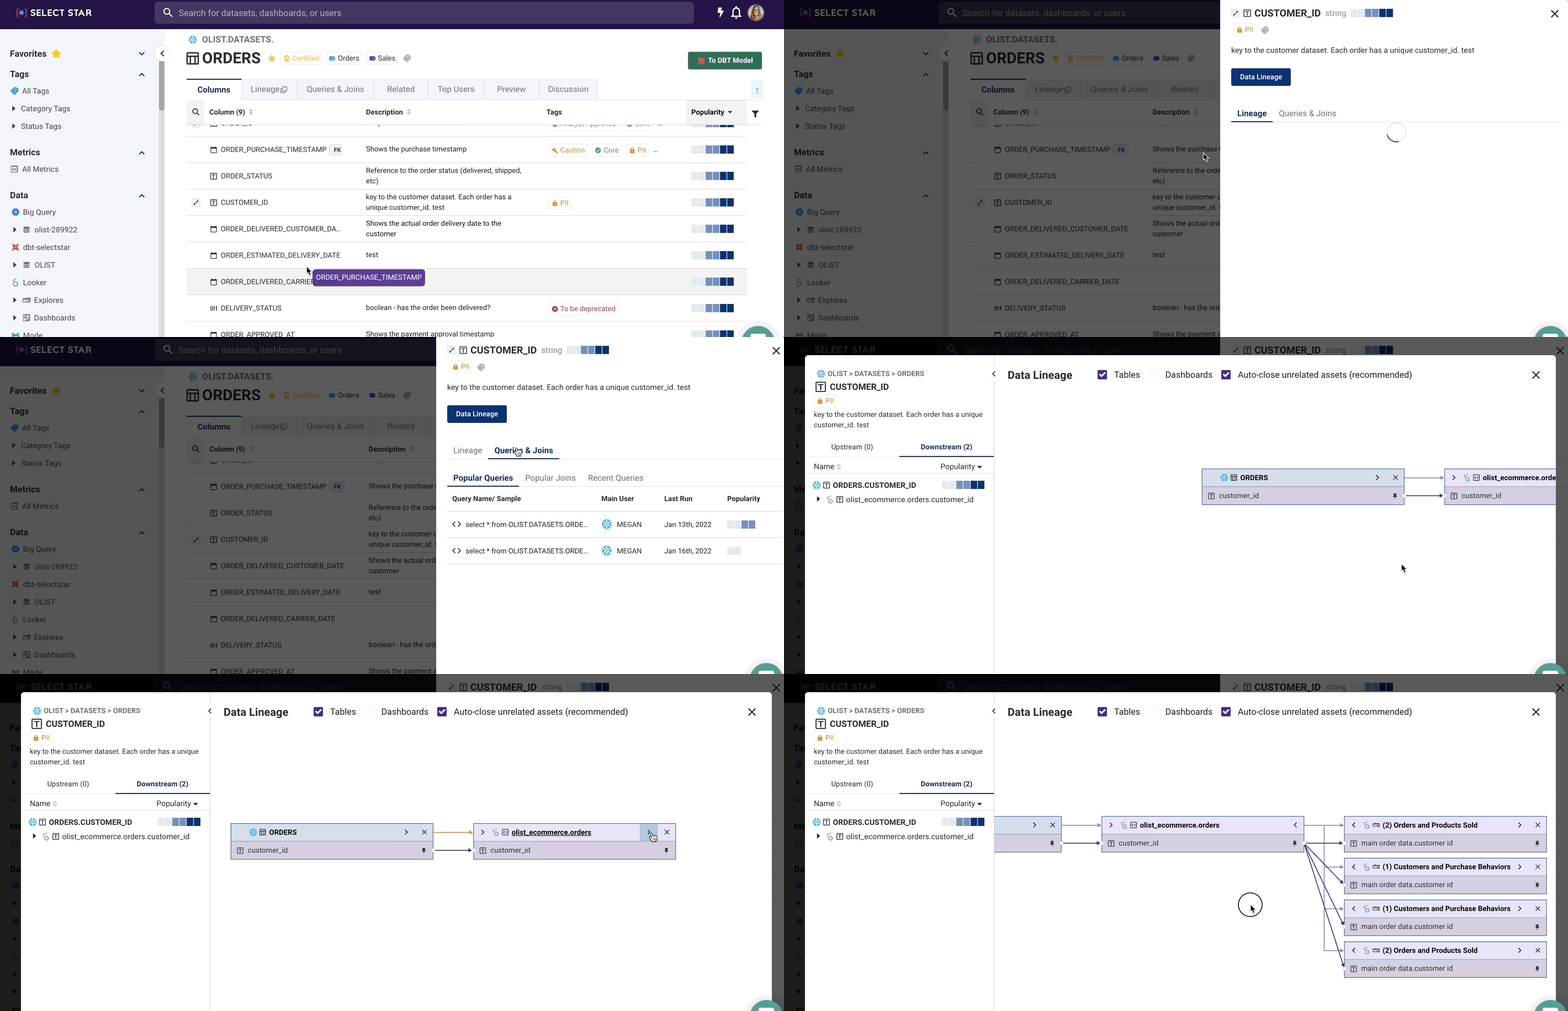
🔎 Smaller graphs for lineage click to focus feature 🔍
Now when you click on a column in a lineage graph, you'll only see columns that are directly upstream or downstream from that column. This will make it much easier to traverse large lineage graphs when you have a table with a lot of columns!
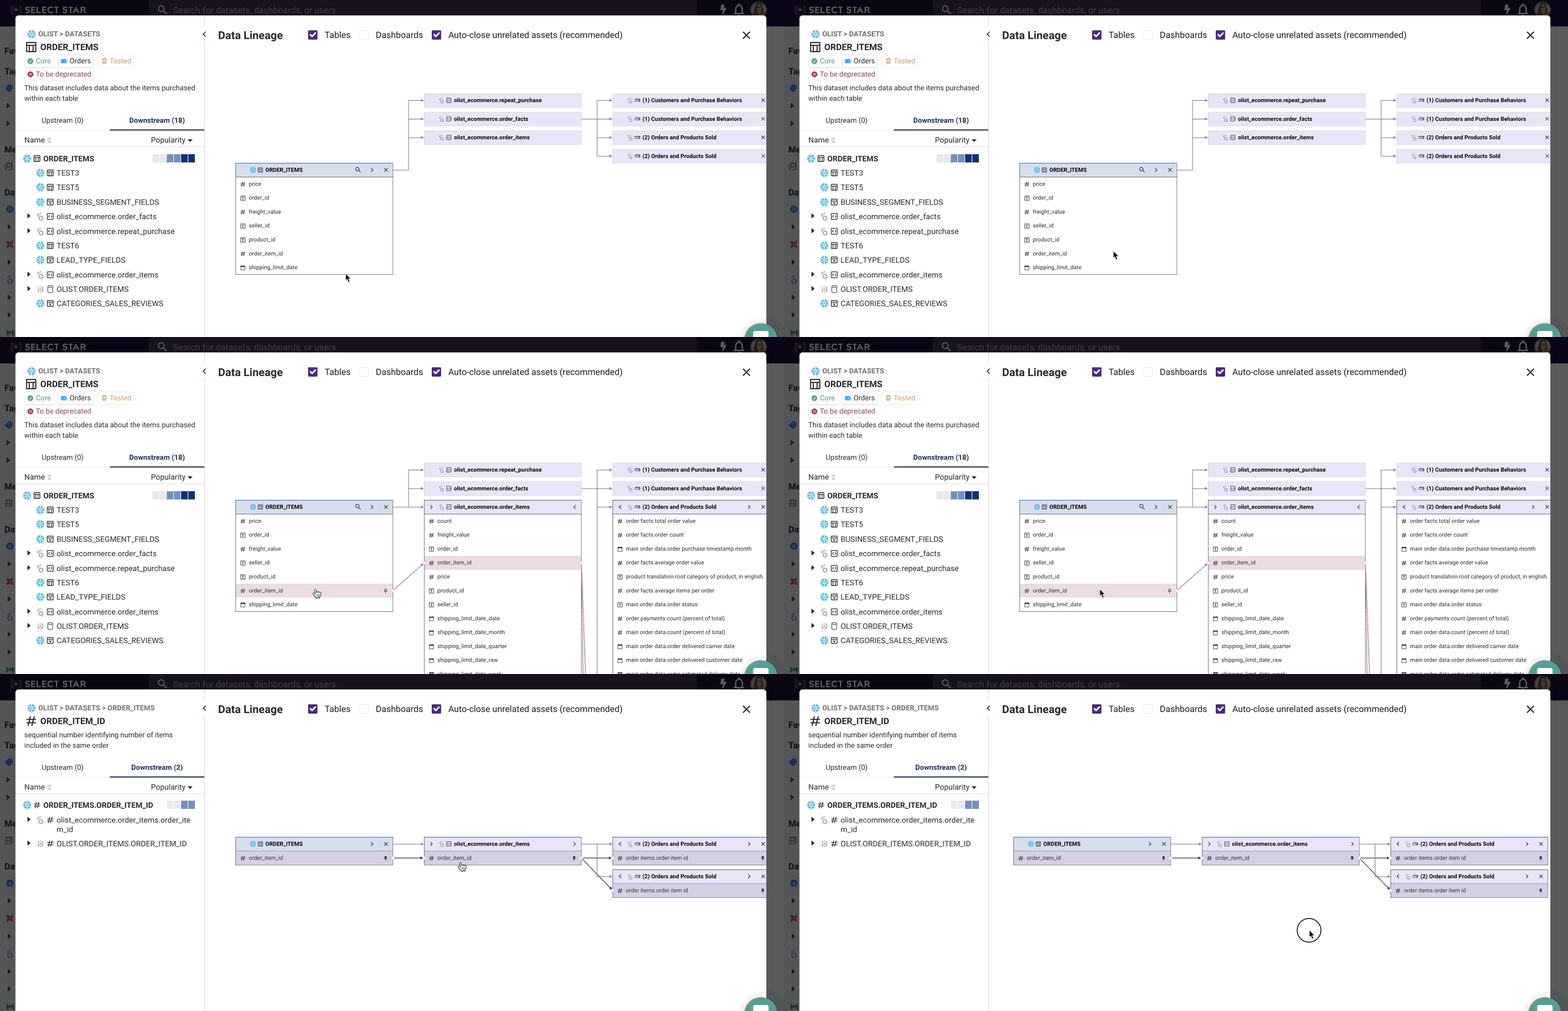
If you still want to see the other columns, you can uncheck Auto-close unrelated assets to show everything by default.
December 22, 2021 - 🎁 Year-end improvements!
Read on to see what's new this week, including...
Walkthrough videos for lineage, table, and database pages
Click join icons to see example joins
Automatic SSO sign-up with any role
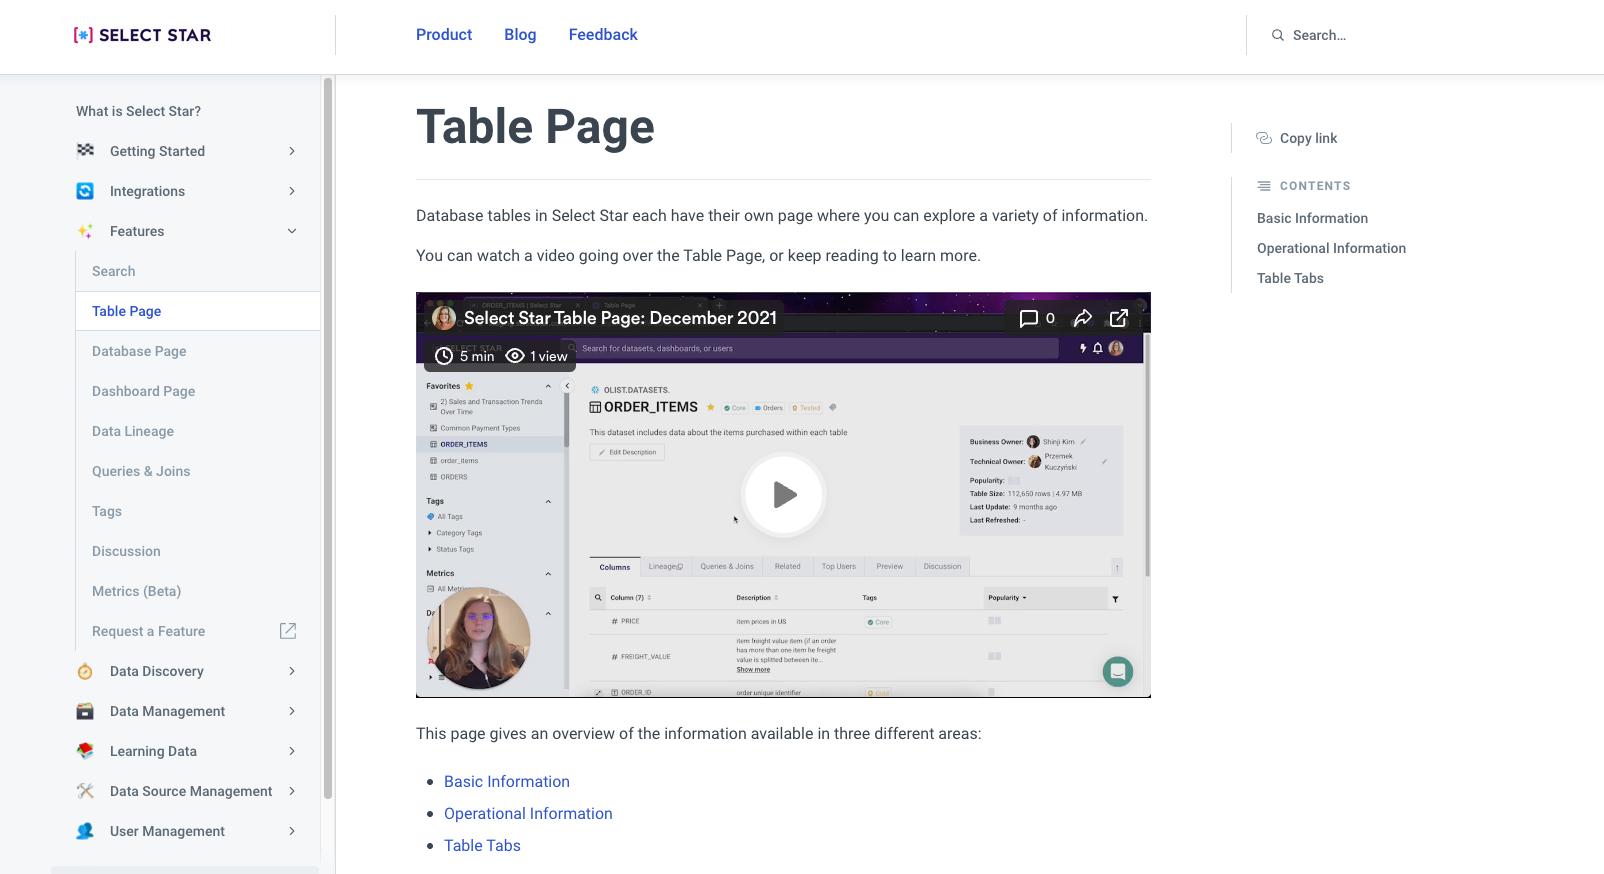
🎥 Loom videos to walk you through our features 🎥 We have a few short Loom videos that will show you in detail how to use data lineage as well as everything you can do in the table and database pages in Select Star.
You can find them in our docs pages. Let us know if you want us to cover any other features in the walk-through videos!
🖇️ Click join icons to quickly see example queries 🖇️ You can see which columns are used in join conditions in Select Star. Click on the join icon to open a modal that shows an example query!
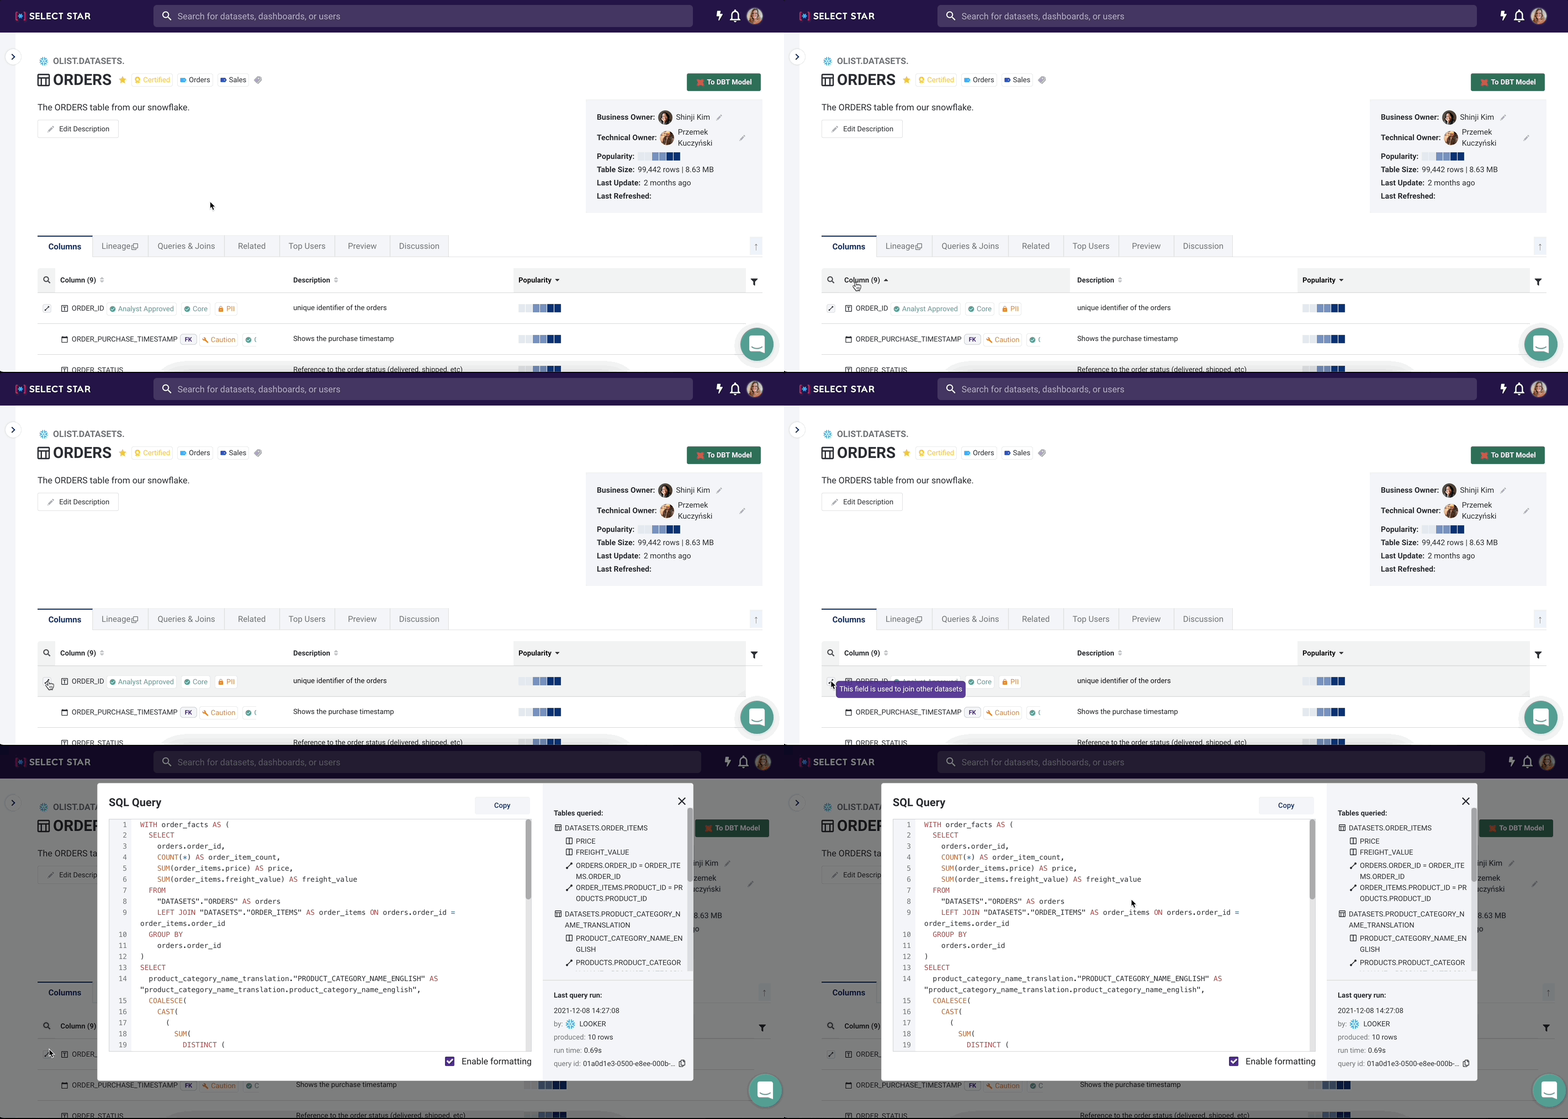
We'll continue improving this page, so thanks for sending in your suggestions!
👥 Allow sign-up via SSO without requiring invitation 👥
You can now allow anyone in your organization to use your SSO provider to sign up for Select Star without an invitation from an Admin.
By default, users who join via your SSO provider will have a Viewer role. Send us a message if you want this option to be turned on for your Select Star organization.
December 14, 2021 - 🤩 Upgraded tag pages, dashboard features, and more!
We've added a lot since our last changelog! Keep reading to learn about...
Comprehensive tag pages
Upstream and downstream counts
Dashboard create dates
Timestamp tooltips
"Invalid date" bug
Postman collection for the API
Easier dbt integrations
🔖 Comprehensive tag pages 🔖
Tag pages are easier to navigate than ever! Now, when you click on a Tag from the All Tags link in the sidebar, you can see tagged data of any type (table, column, dashboard, Select Star metric, etc) all at once!
You can still apply filters in the sidebar and to the table results to easily find exactly what you're looking for.

🔢 Upstream and downstream counts 🔢
It's easier than ever to see which objects have dependencies elsewhere in your data stack. From a database page or reports page, you can now see at a glance how many objects exist upstream or downstream of your tables and dashboards.
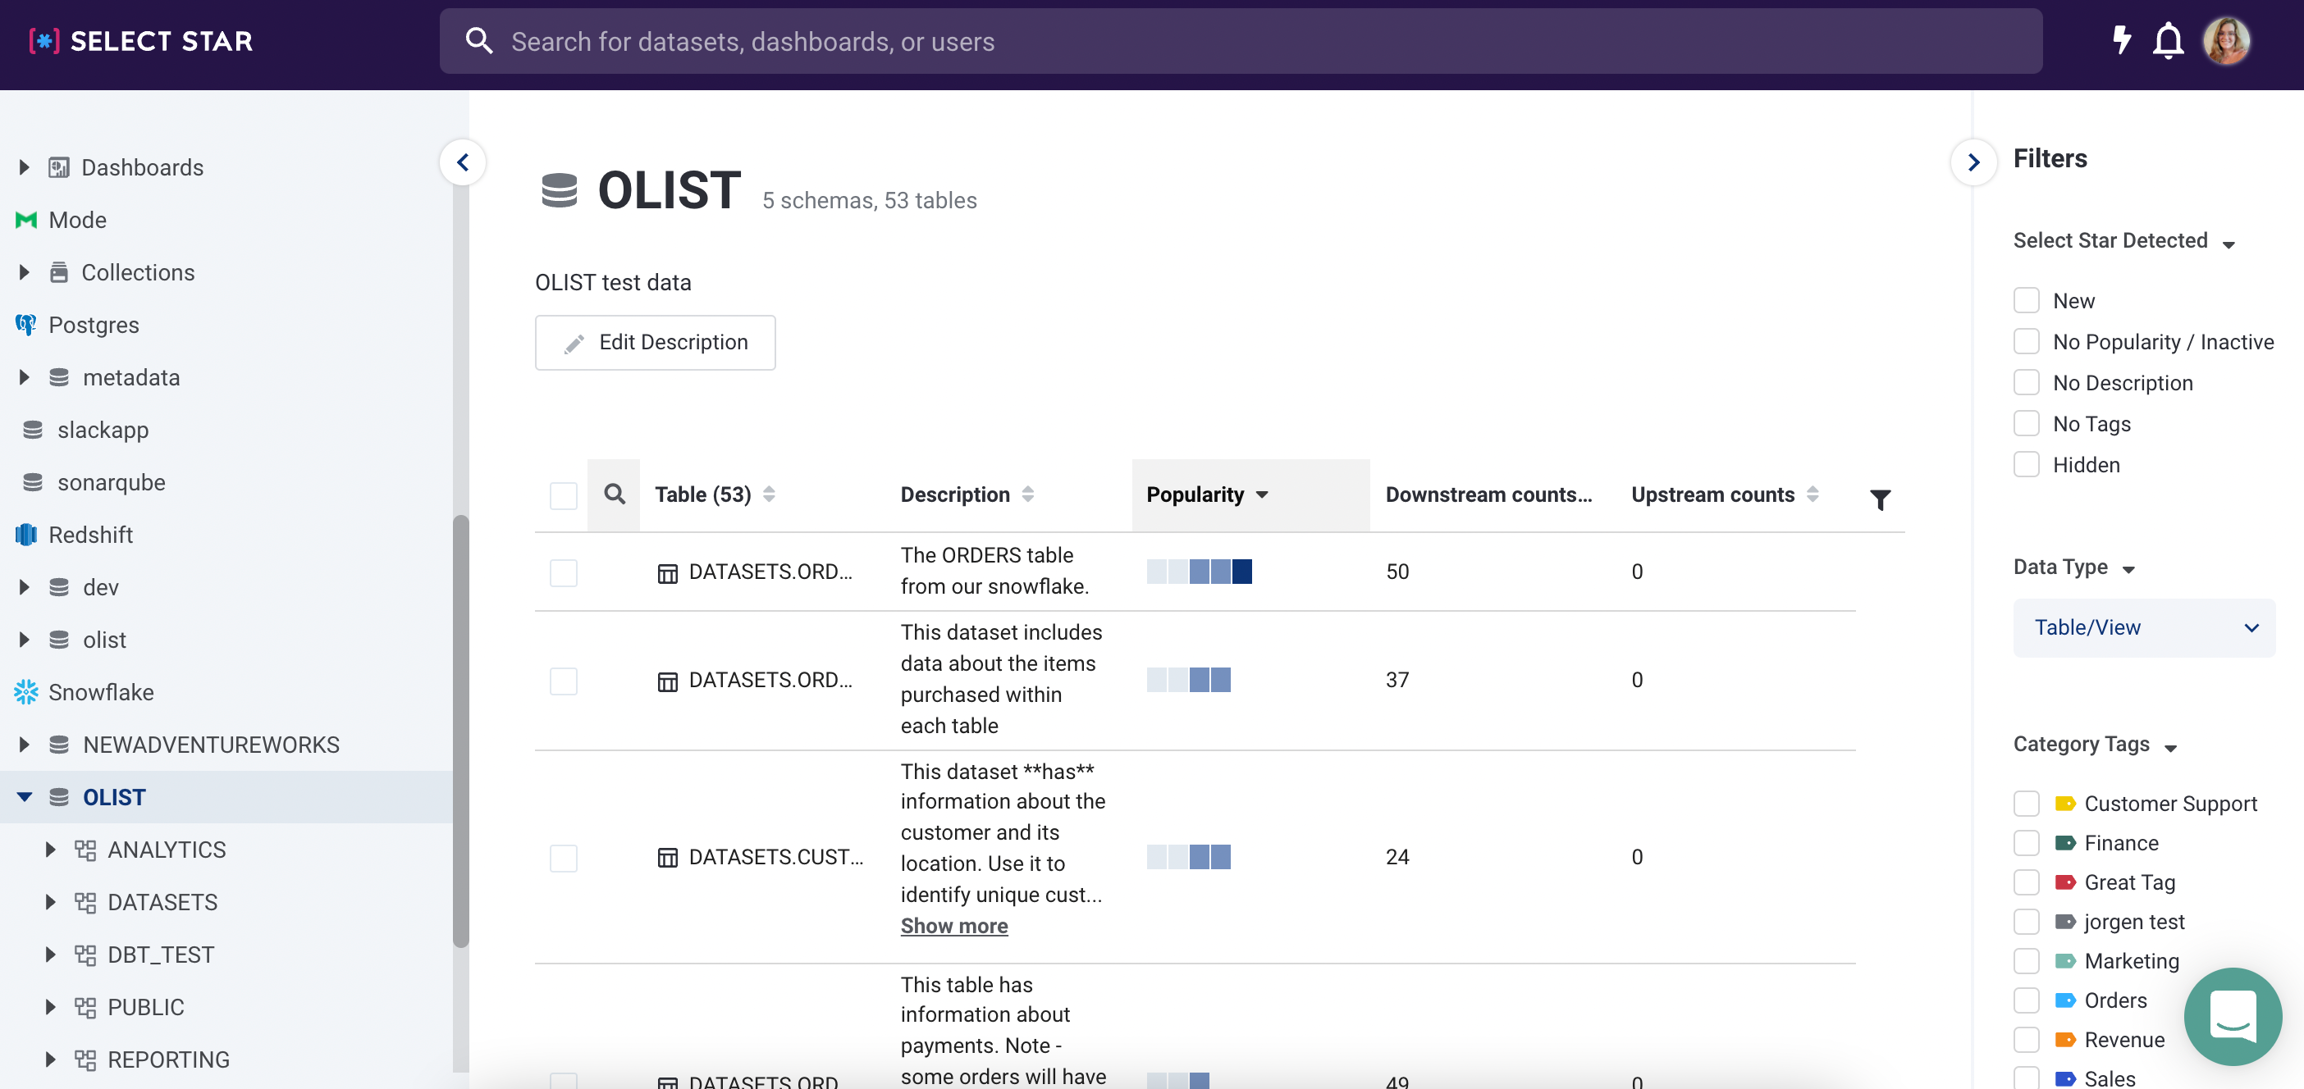
Not seeing upstream or downstream counts? 🧐 Don't forget, you can customize what information you see in a database or report page by clicking the filter icon on the right side of the table header. 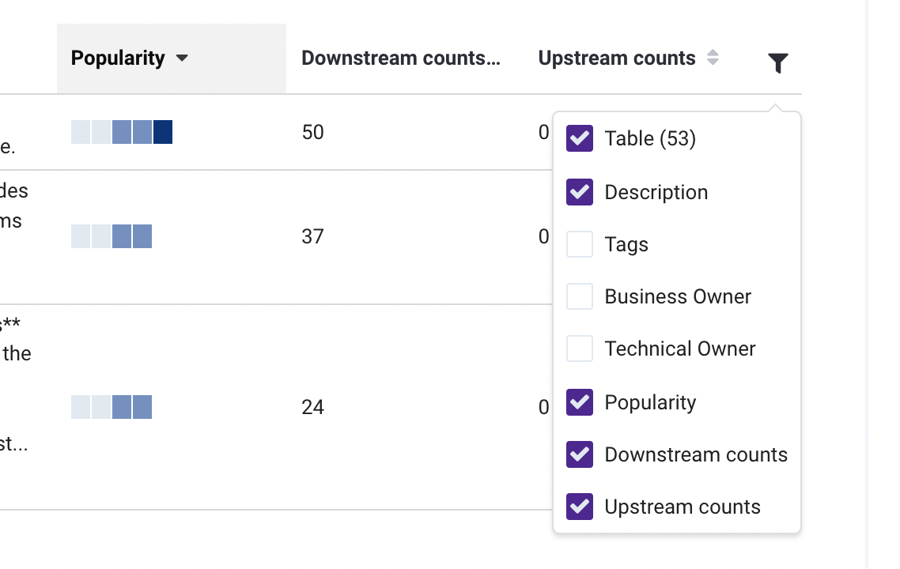
💡 Dashboard create dates 💡
Looker and Mode users will notice that Select Star shows when a dashboard was created in the Operational Information box. You can also see this information on the main reports page.
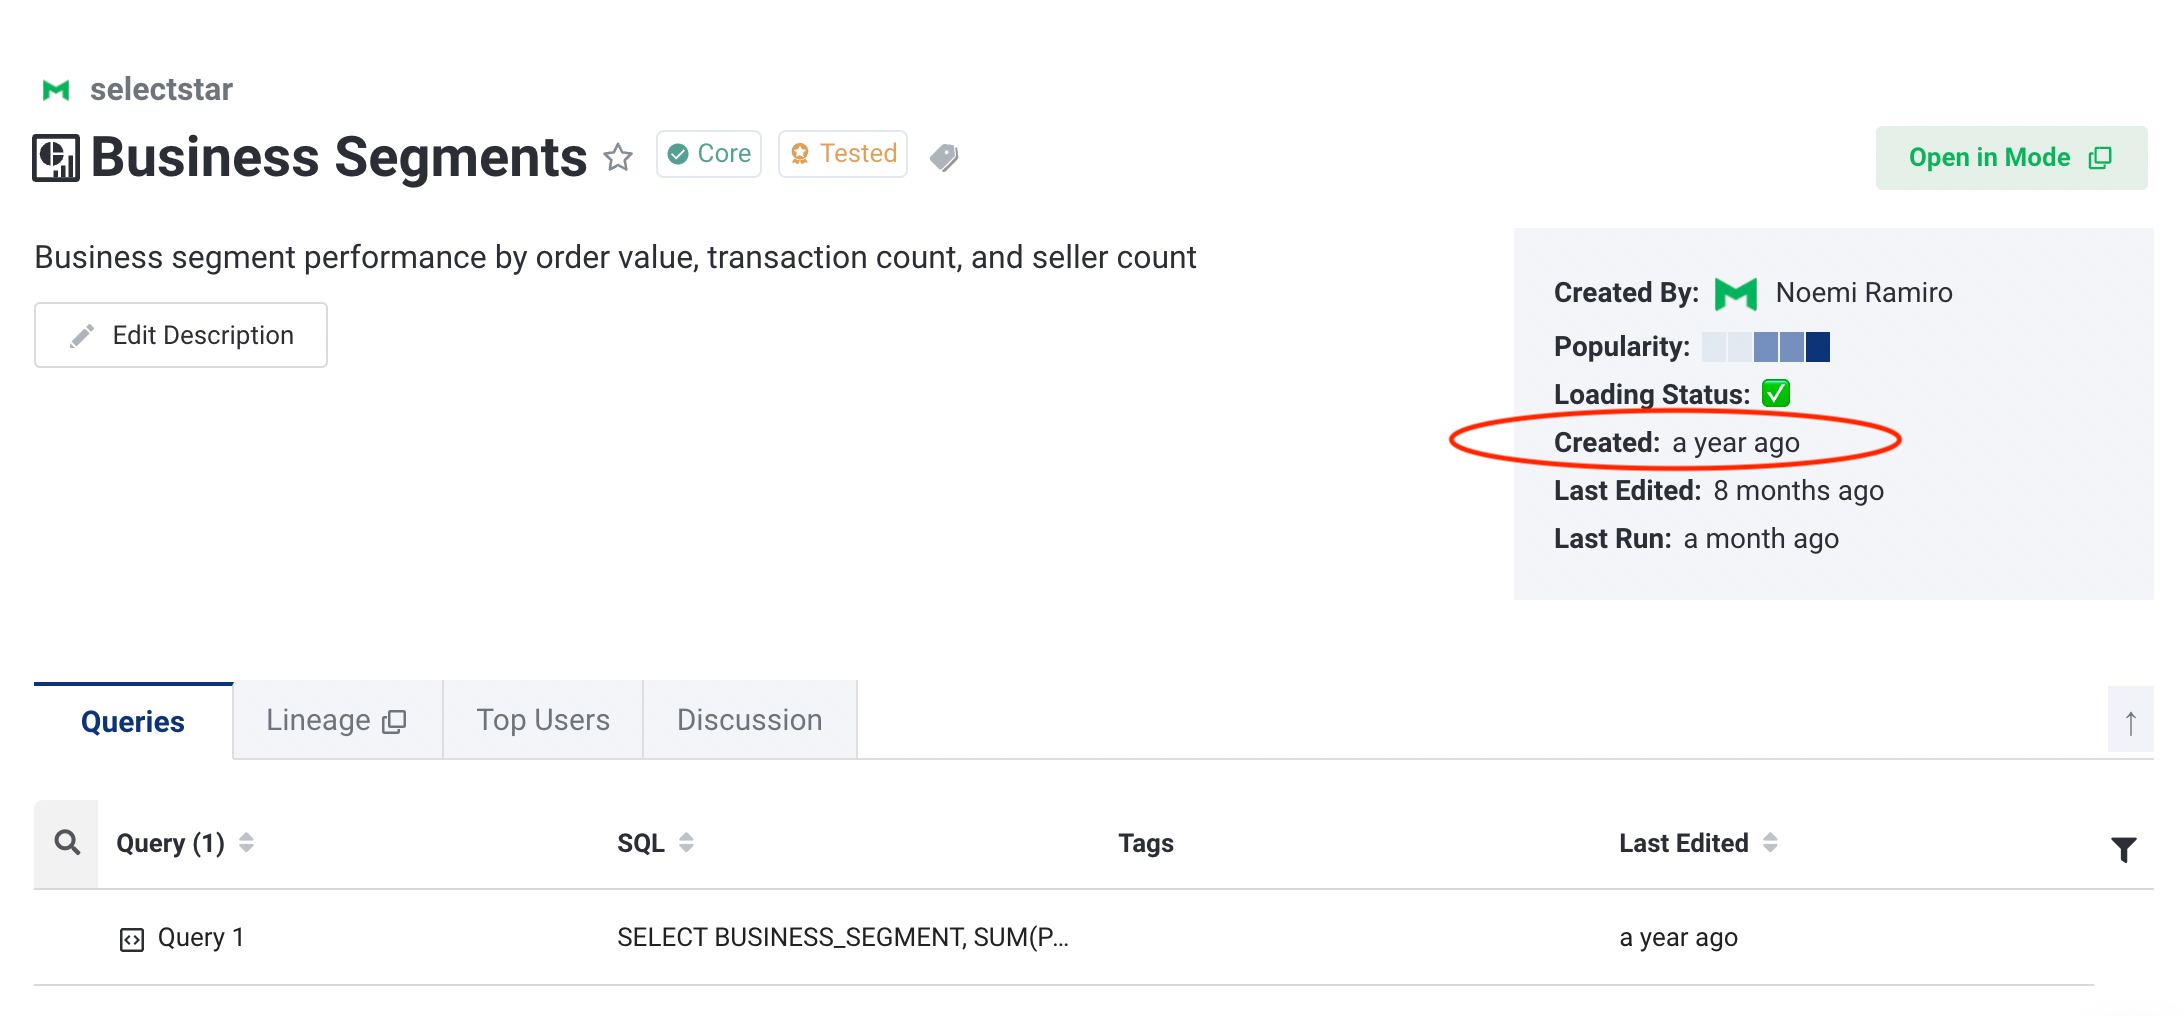
⏰ ...AND timestamp tooltips ⏰
Not only that, but you can now see the exact date and time by hovering over any date in the app! 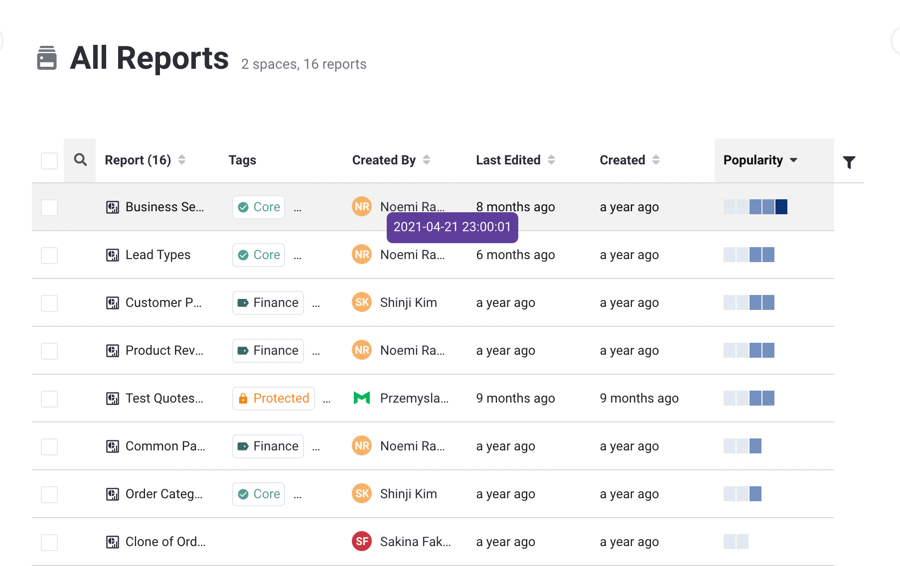
🐛 "Invalid date" bug is fixed 🐛
Speaking of dashboards, you won't see Invalid date any more when trying to find out when a dashboard was last run, edited, or created. That bug has been squashed 😉 You might still see a few Unknown values if your dashboard hasn't been tended to in a while 🥀
🚀 Postman collection for the API 🚀
We've had a few people ask for this, and we're excited to give you a Postman Collection for the Select Star API. You can see the collection by clicking the link below 👇 👇 https://www.postman.com/selectstarhq/workspace/select-star/overview If this is the first you're hearing of the Select Star API, check out our docs over at https://docs.selectstar.com/select-star-api to get started.
🔄 Easier dbt integrations 🔄
We've simplified our dbt integration even more. Now, all we need is your manifest.json, and, if you're adding dbt as a standalone datasource, your catalog.json files.
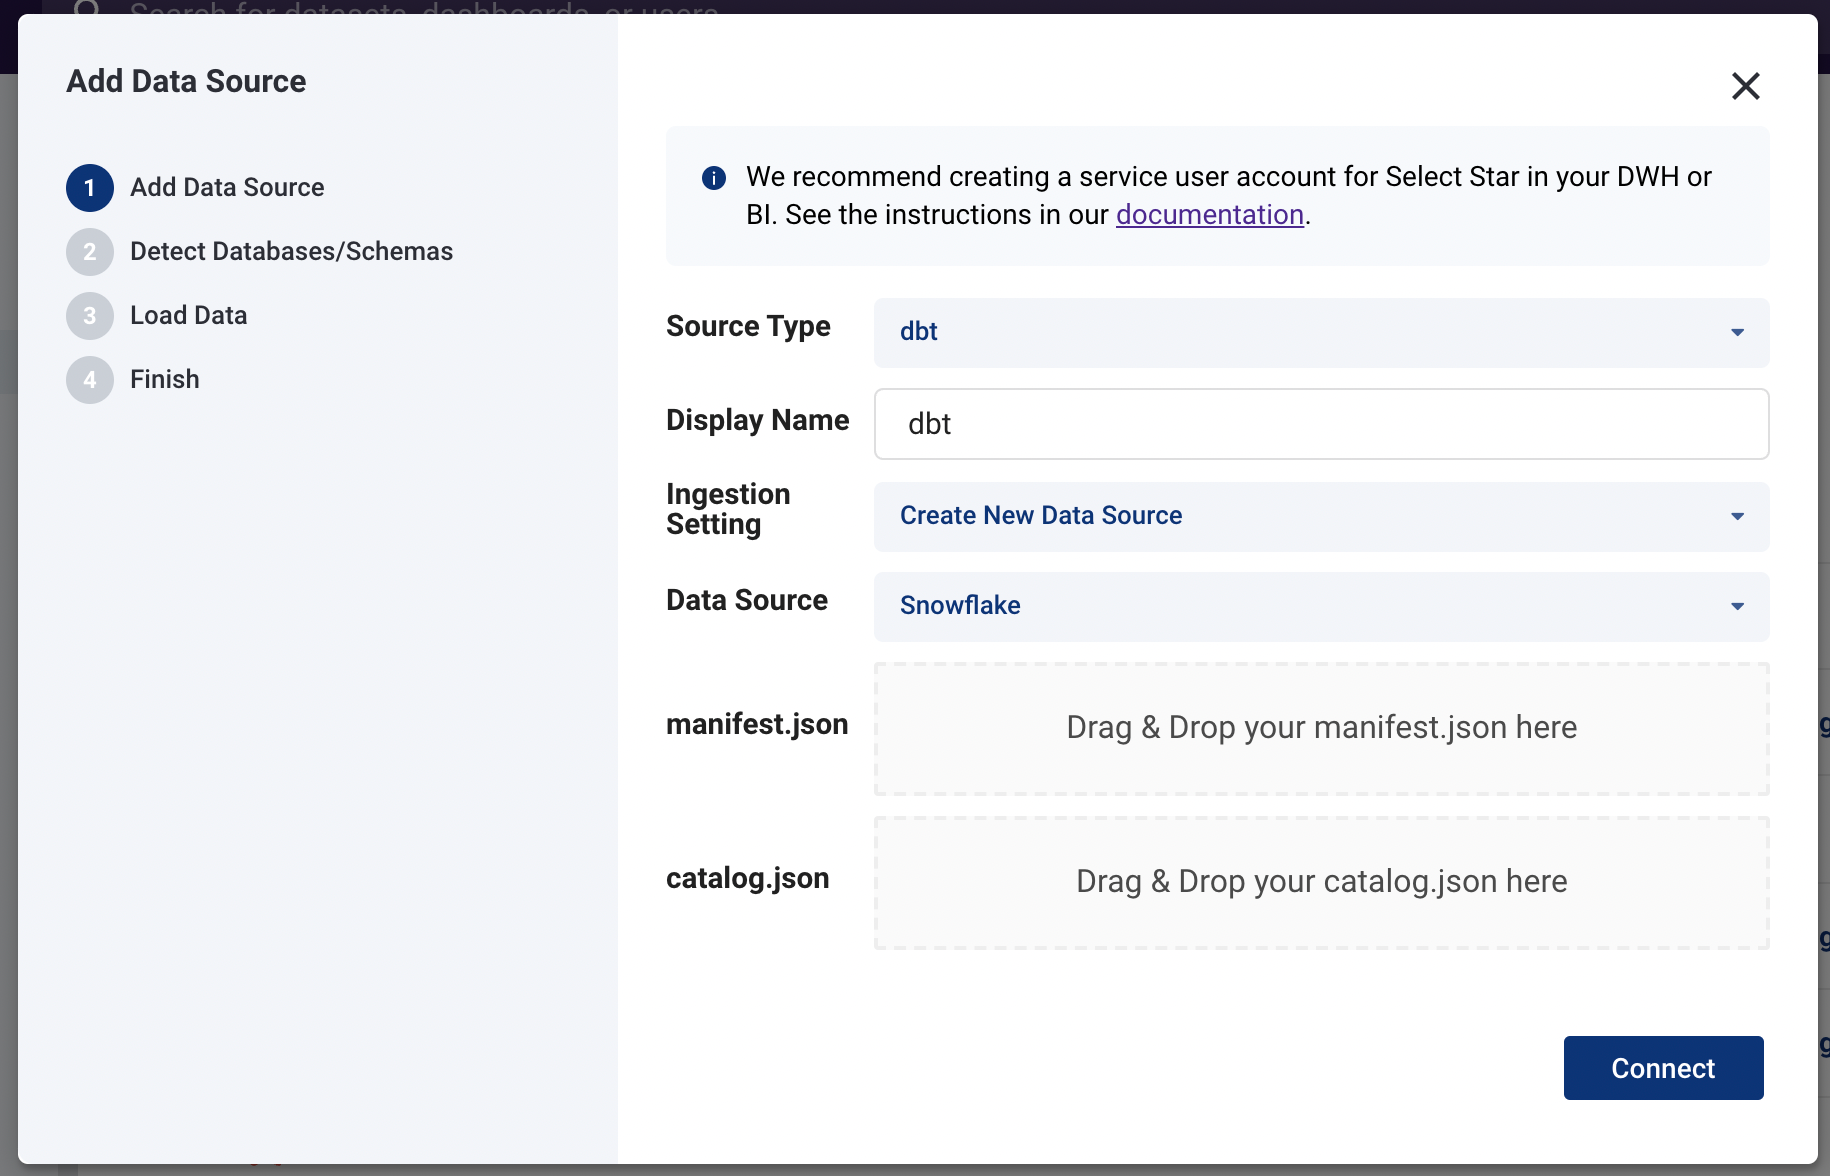
You can set these to update automatically using the API. Learn more about our dbt integration at https://docs.selectstar.com/integrations/dbt.
November 29, 2021 - Stay logged in longer!
⏲️ Access/Refresh tokens are updated! ⏲️
When you log in to Select Star, you'll now stay in logged in for 30 days. Thanks to Matthew Isanuk for the suggestion!
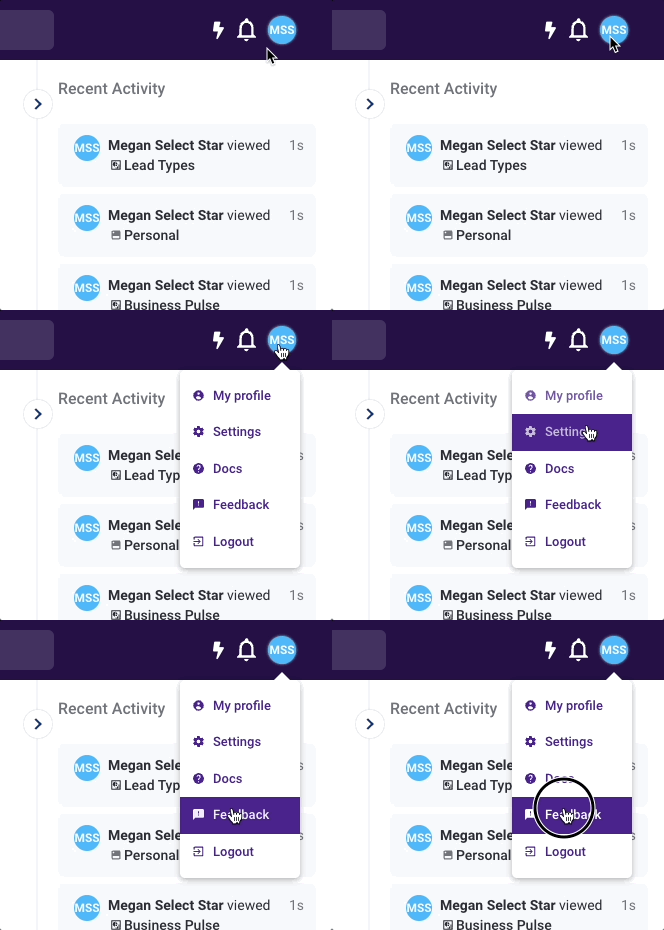
If you want to leave us feedback or vote on topics like this, click your icon and then Feedback. We're always happy to hear from you.
November 18, 2021 - 🎉 Exciting times and new features!
Read on to learn about our recent updates, including...
Our General Availability launch!
Snowflake Tag Sync
Downstream Column Tagging
Hiding and Unhiding data
🌟 Select Star 30 day free trials are available through our website! 🌟
A huge thanks to everyone who helped spread the word about our launch. For anyone else enjoying Select Star, please share the news with your network!
❄️ Sync Select Star Tags back to Snowflake ❄️
Select Star is partnering with Snowflake to bring you better data governance tools. You can now find the Snowflake Tag Sync feature in Select Star's settings page.
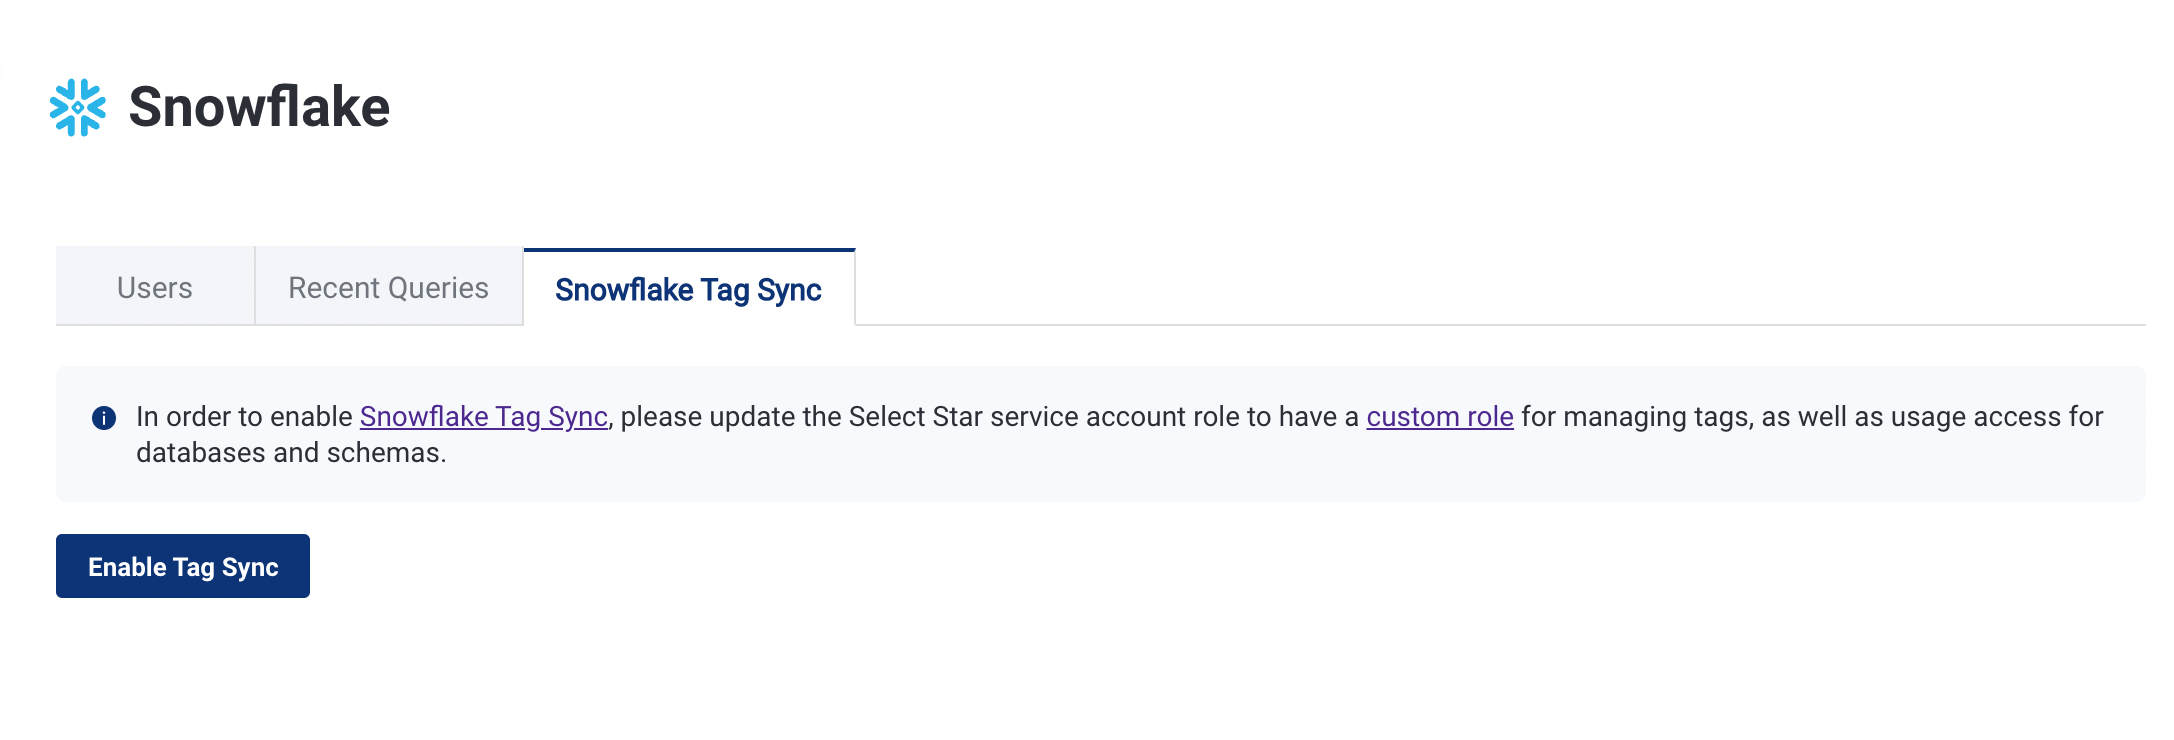
Create a tag role and have all of your Snowflake data automatically updated with tags you've created in Select Star.
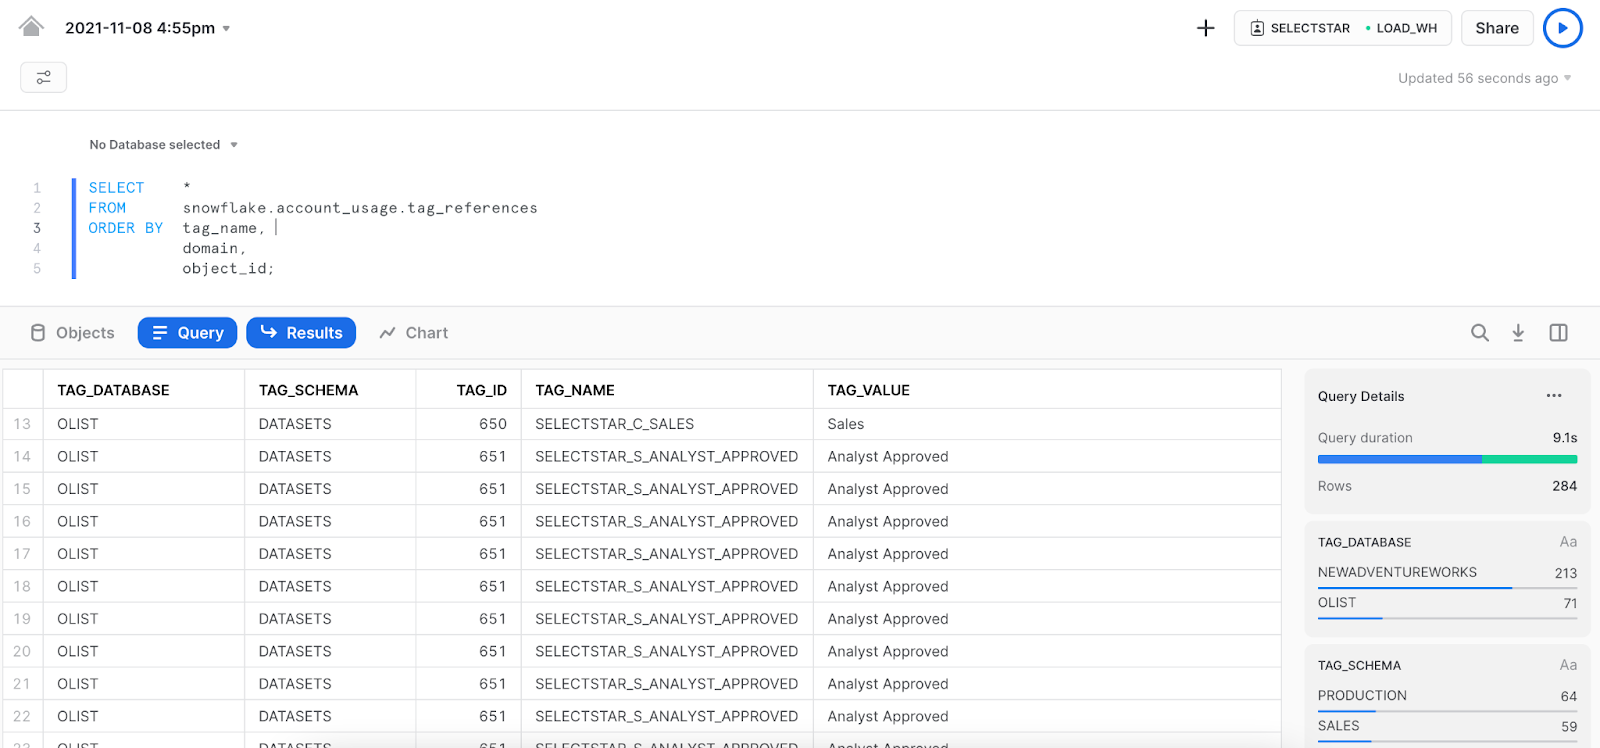
Find out more by visiting our docs.
🏞️ Downstream column tagging 🏞️
Find out how a column is propagated in other tables, whether it is used As Is, Aggregated, or Transformed, with downstream column tagging. You can apply Tags while exploring different ways the columns are used, which can be especially helpful when tagging PII.

🥸 Hide and Unhide tables more easily 😀
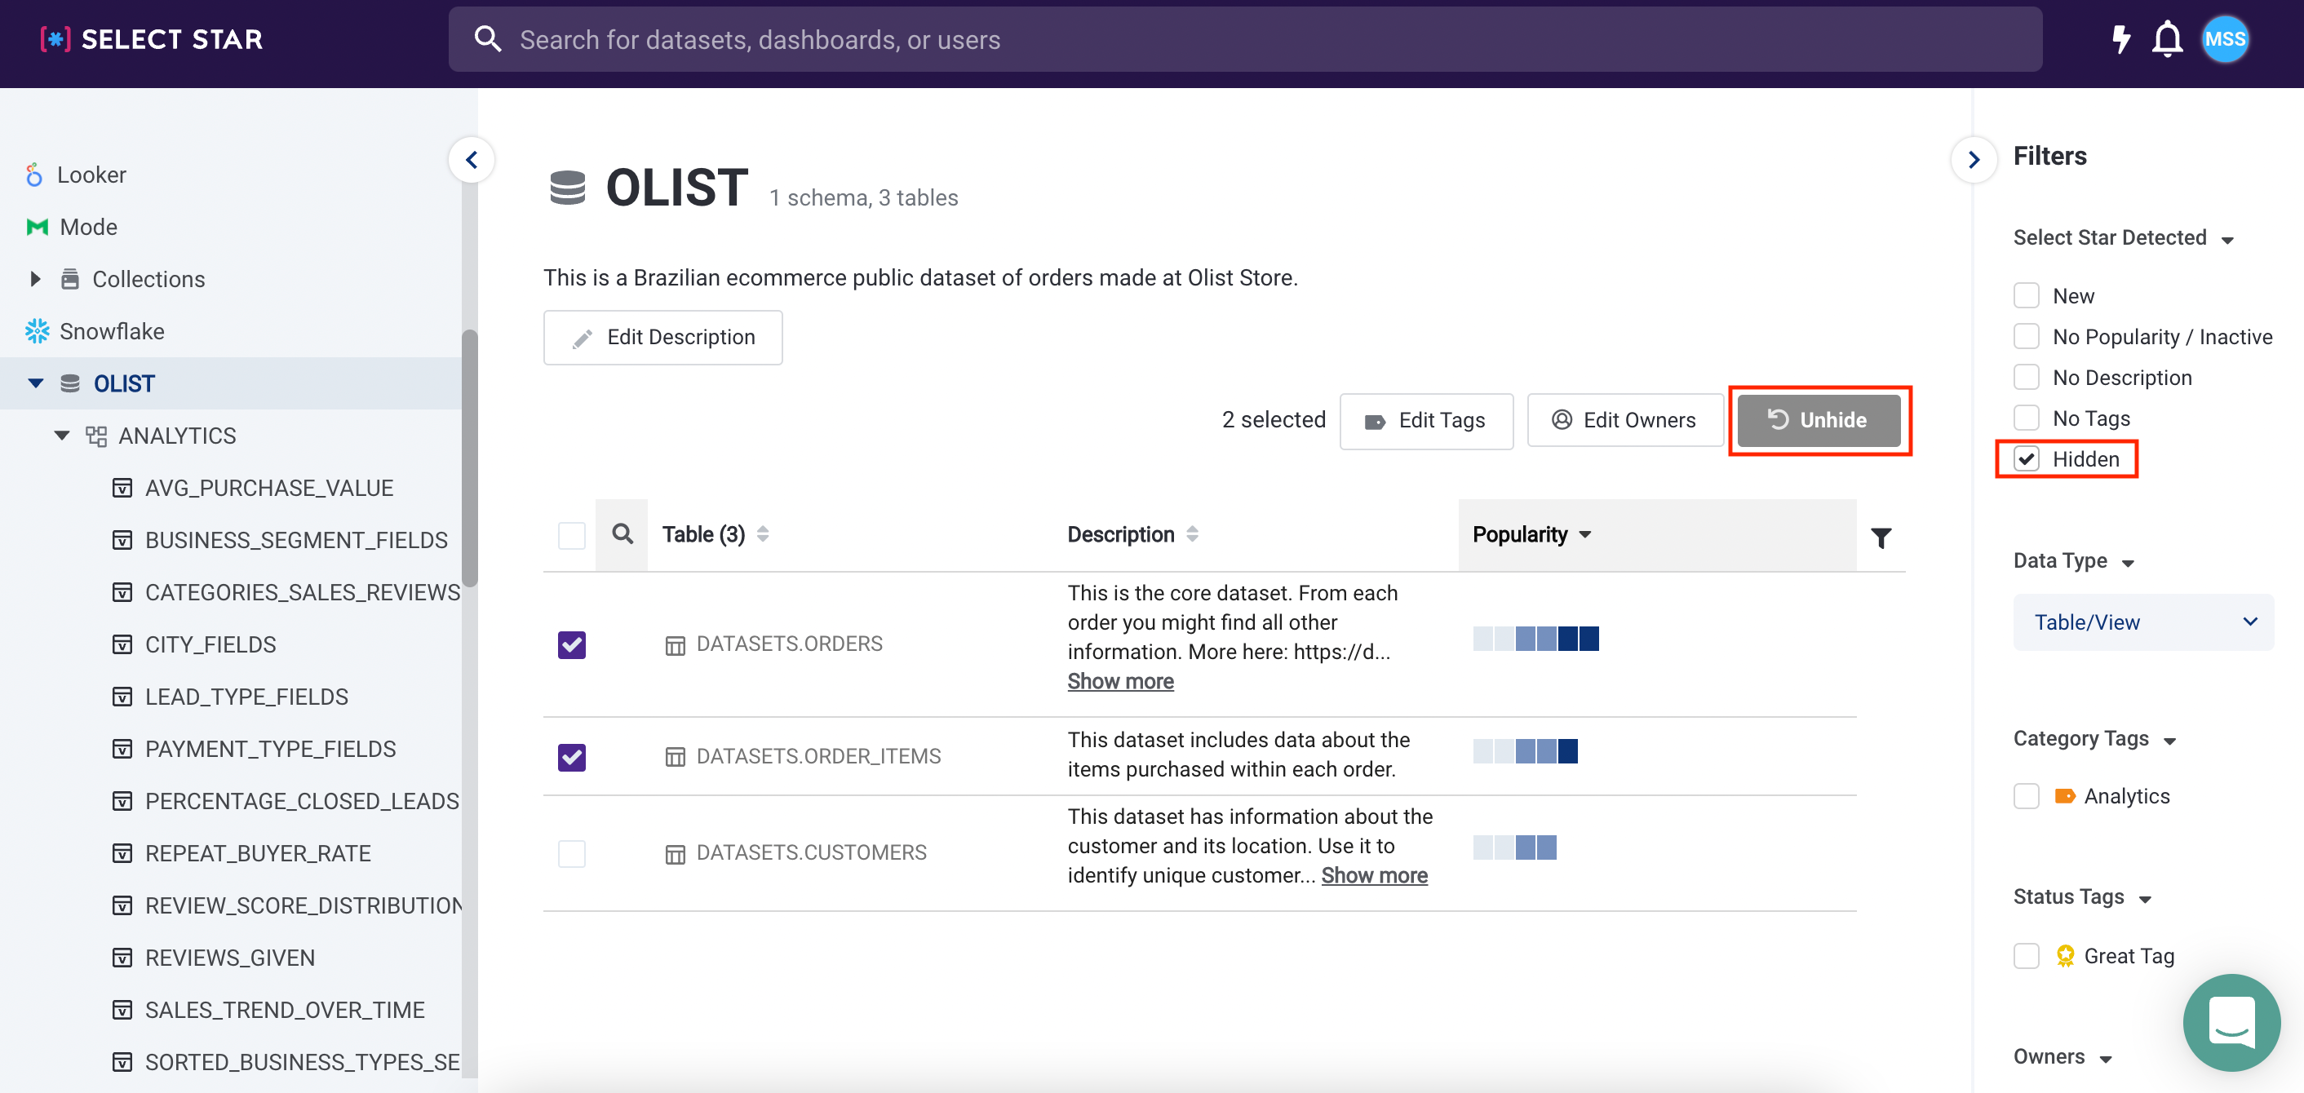
Did you know you can hide tables from the UI in Select Star? Cloned tables, temp tables, or tables with PII don't need to be seen by everyone in your organization. But if you change your mind, or hide something by mistake, you can see hidden datasets and even un-hide them.
November 5, 2021 - 🖼 Data Source User Profile
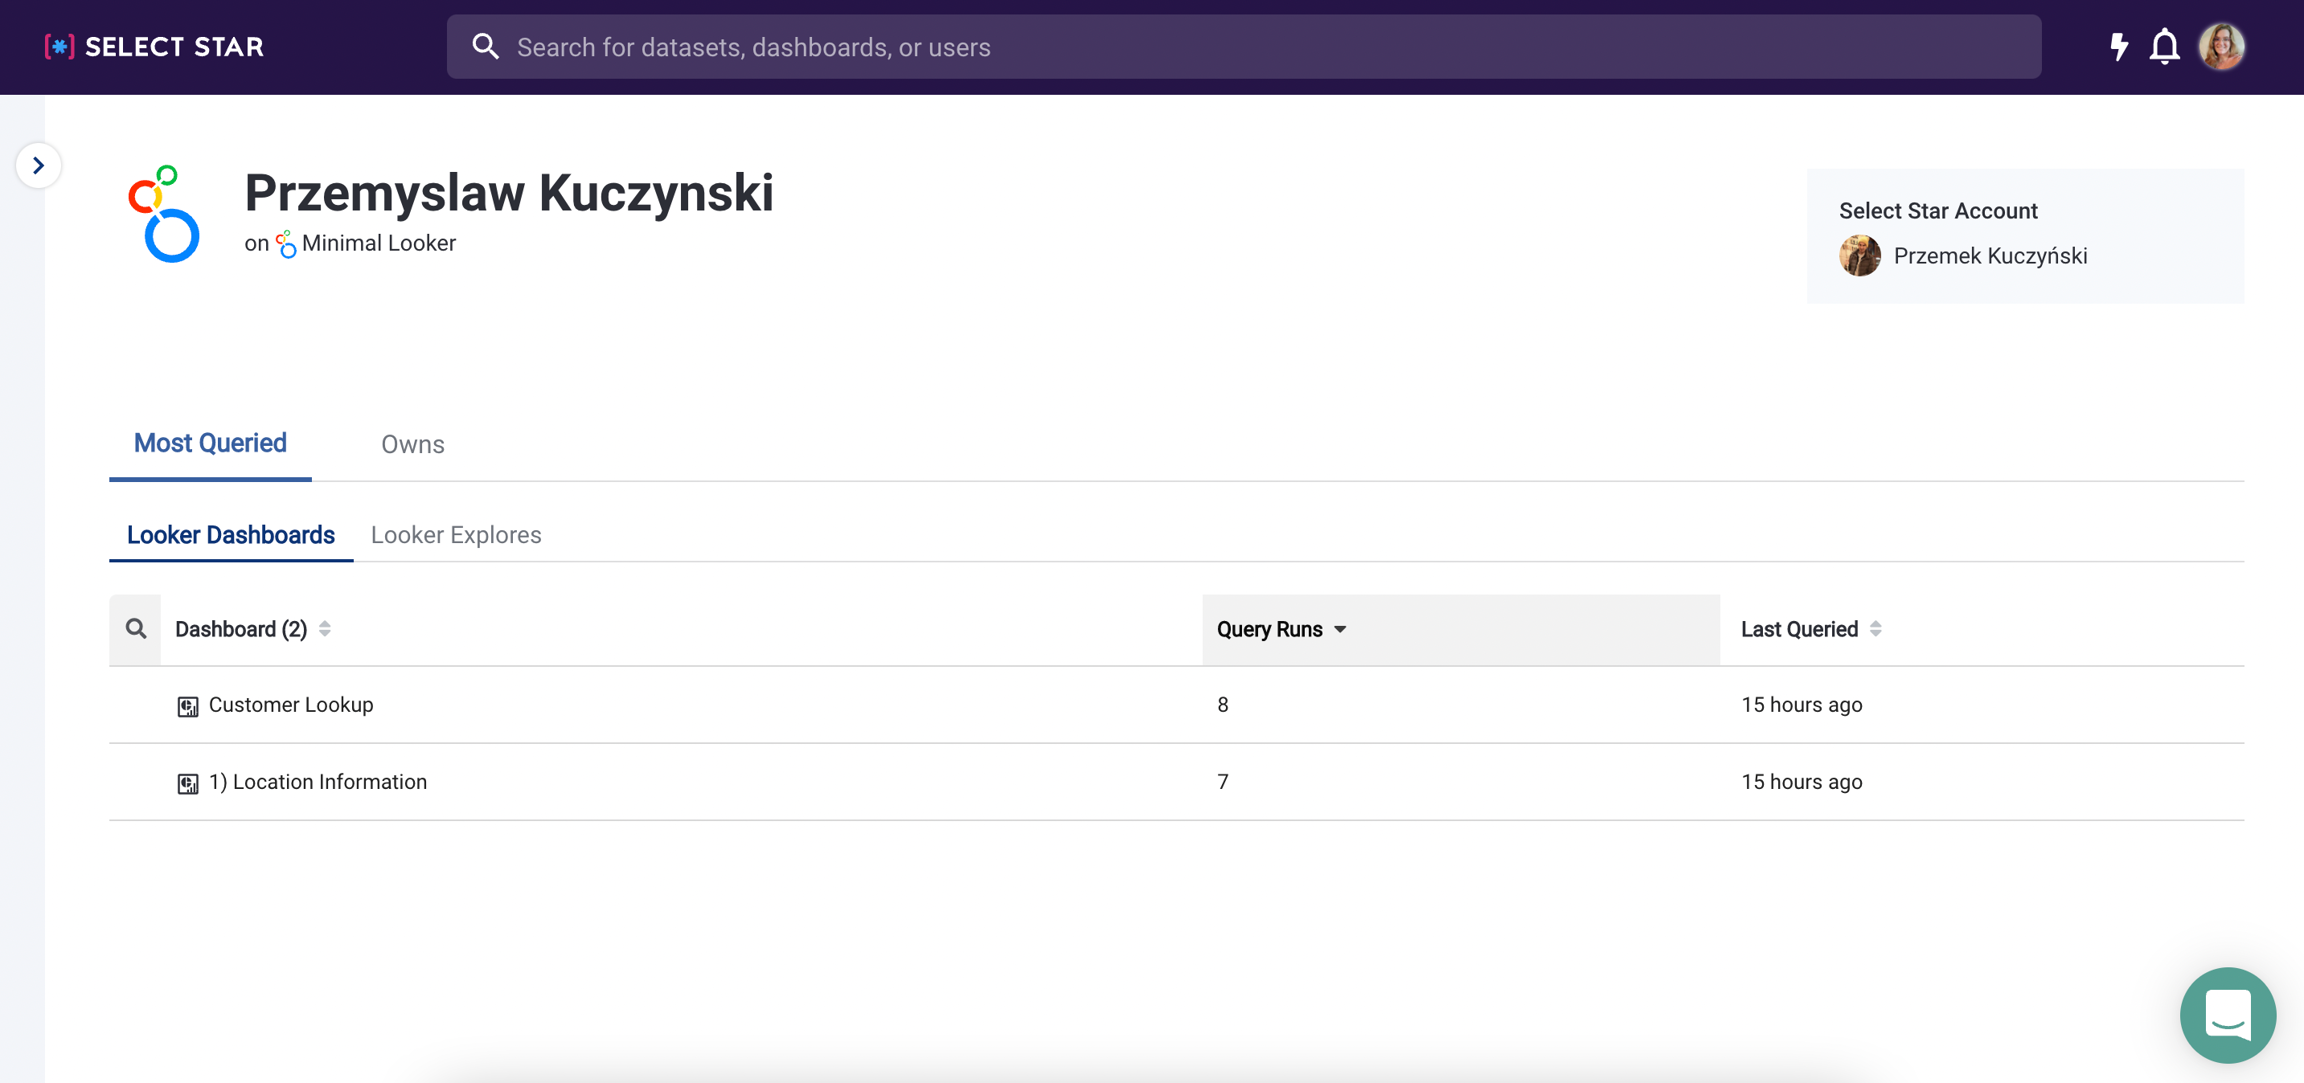
Did you know that you can look up any DWH or BI user in Select Star? We just improved our User Profile page so you can see all the information in one place.
The updated profile page will tell you which tables, dashboards they use the most, as well as recent queries they've made:
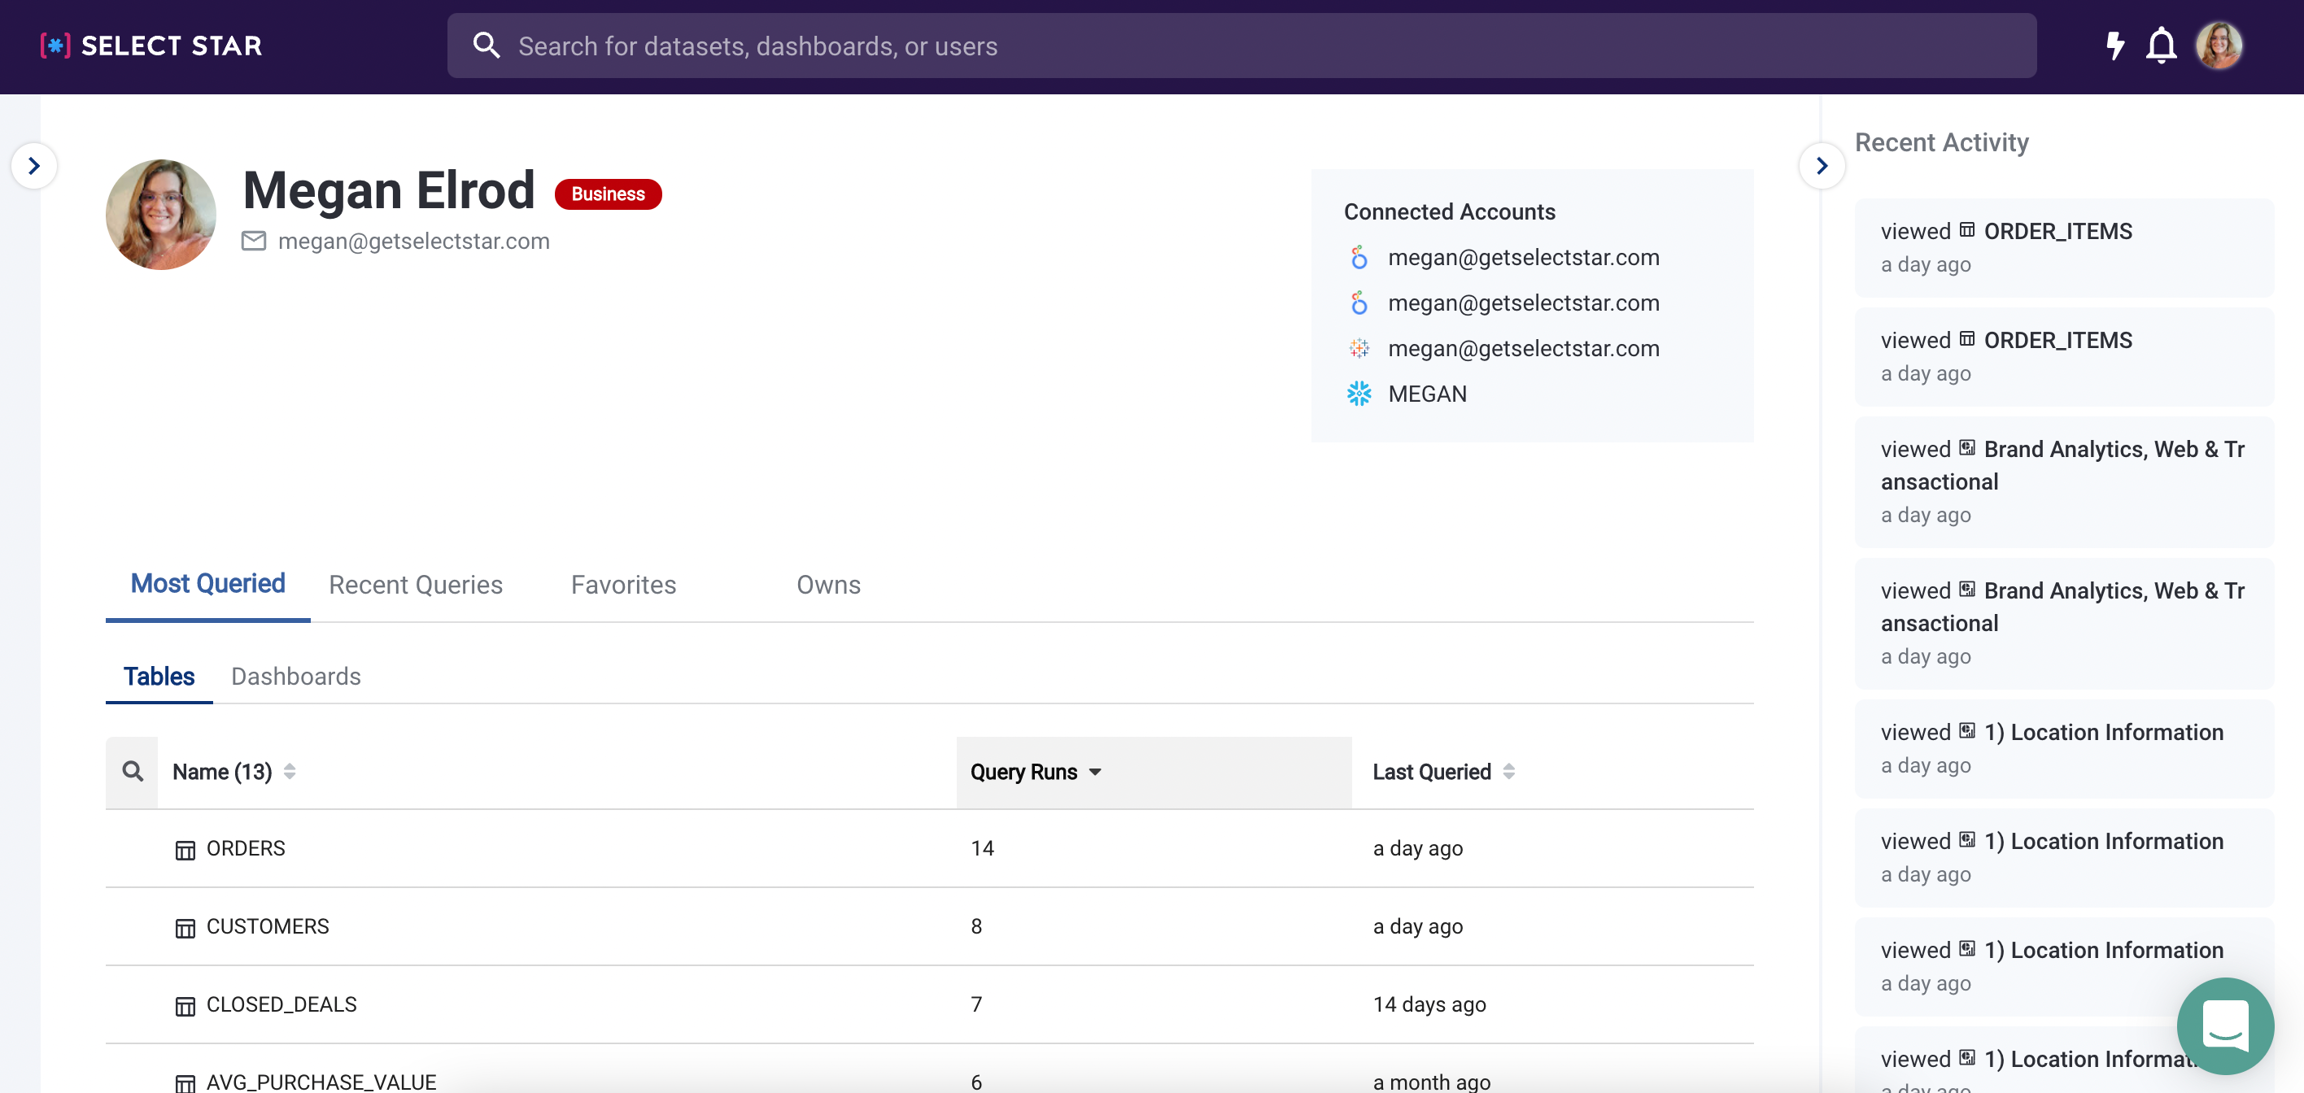
Even if the user you're looking for hasn't registered for Select Star yet, we'll show their profile when we load your DWH and BI. It shows the user's activity on that tool, as well as an Owns tab which has BI dashboards or other data assets they've created.
October 18, 2021 - Redshift integrations, column lineage search, and more!
Read on to learn about recent changes, including...
Redshift and dbt integrations
Easier lineage navigation
Last Refreshed timestamp
Data Source Connection status
✨ 1. Redshift and dbt integrations are here!
Our AWS Redshift and dbt integrations are now fully self-serve from settings. You can find instructions for adding them to your Select Star instance here.
🔍 2. Search in lineage
For those of you with lots of columns in your Looker Explores and DWH tables, we have good news! You can now search on the graph for a specific column.
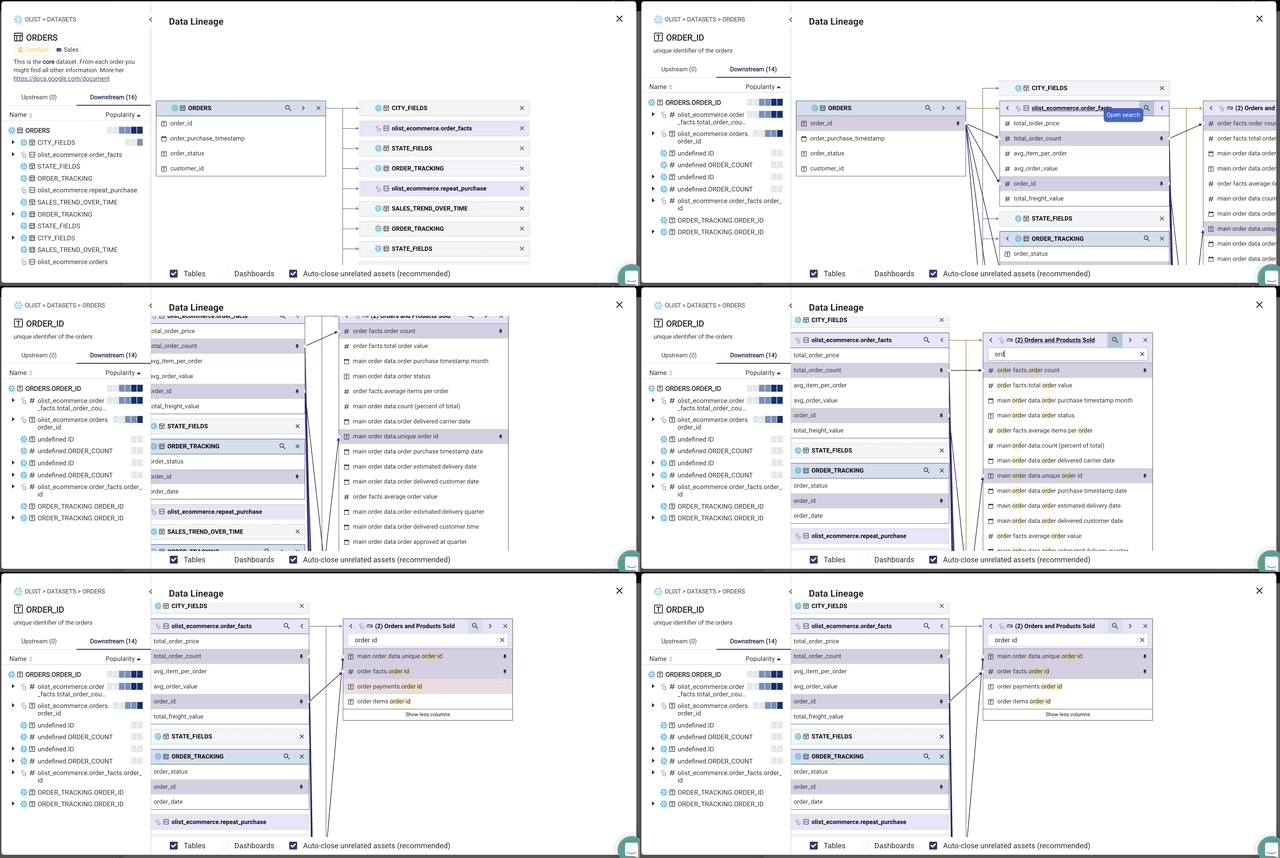
You may also notice that the lineage sidebar has moved to the left side of the screen. You can always use the lineage sidebar to browse through the same lineage the graph shows in a more compact format.
🔄 3. Last Refreshed timestamp
We now show the Last Refreshed timestamp under the Last Update on your data tables.
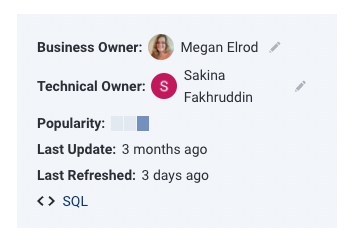
While Last Update tells you when the metadata on your table last changed - for example, columns were added or removed - Last Refreshed shows when the data values were last changed, such as with an INSERT or UPDATE query.
⚡ 4. Data Source Connection status
We've taken the guesswork out of changing credentials on your data sources. If we lose access to your data source, you'll be able to see a warning symbol next to it from the Settings page.

That'll be your cue to check with someone with admin access to that tool that all permissions are in place. If you need to confirm what permissions Select Star needs, you can check out our integration pages.
September 27, 2021 - What's new in Select Star - September 27, 2021
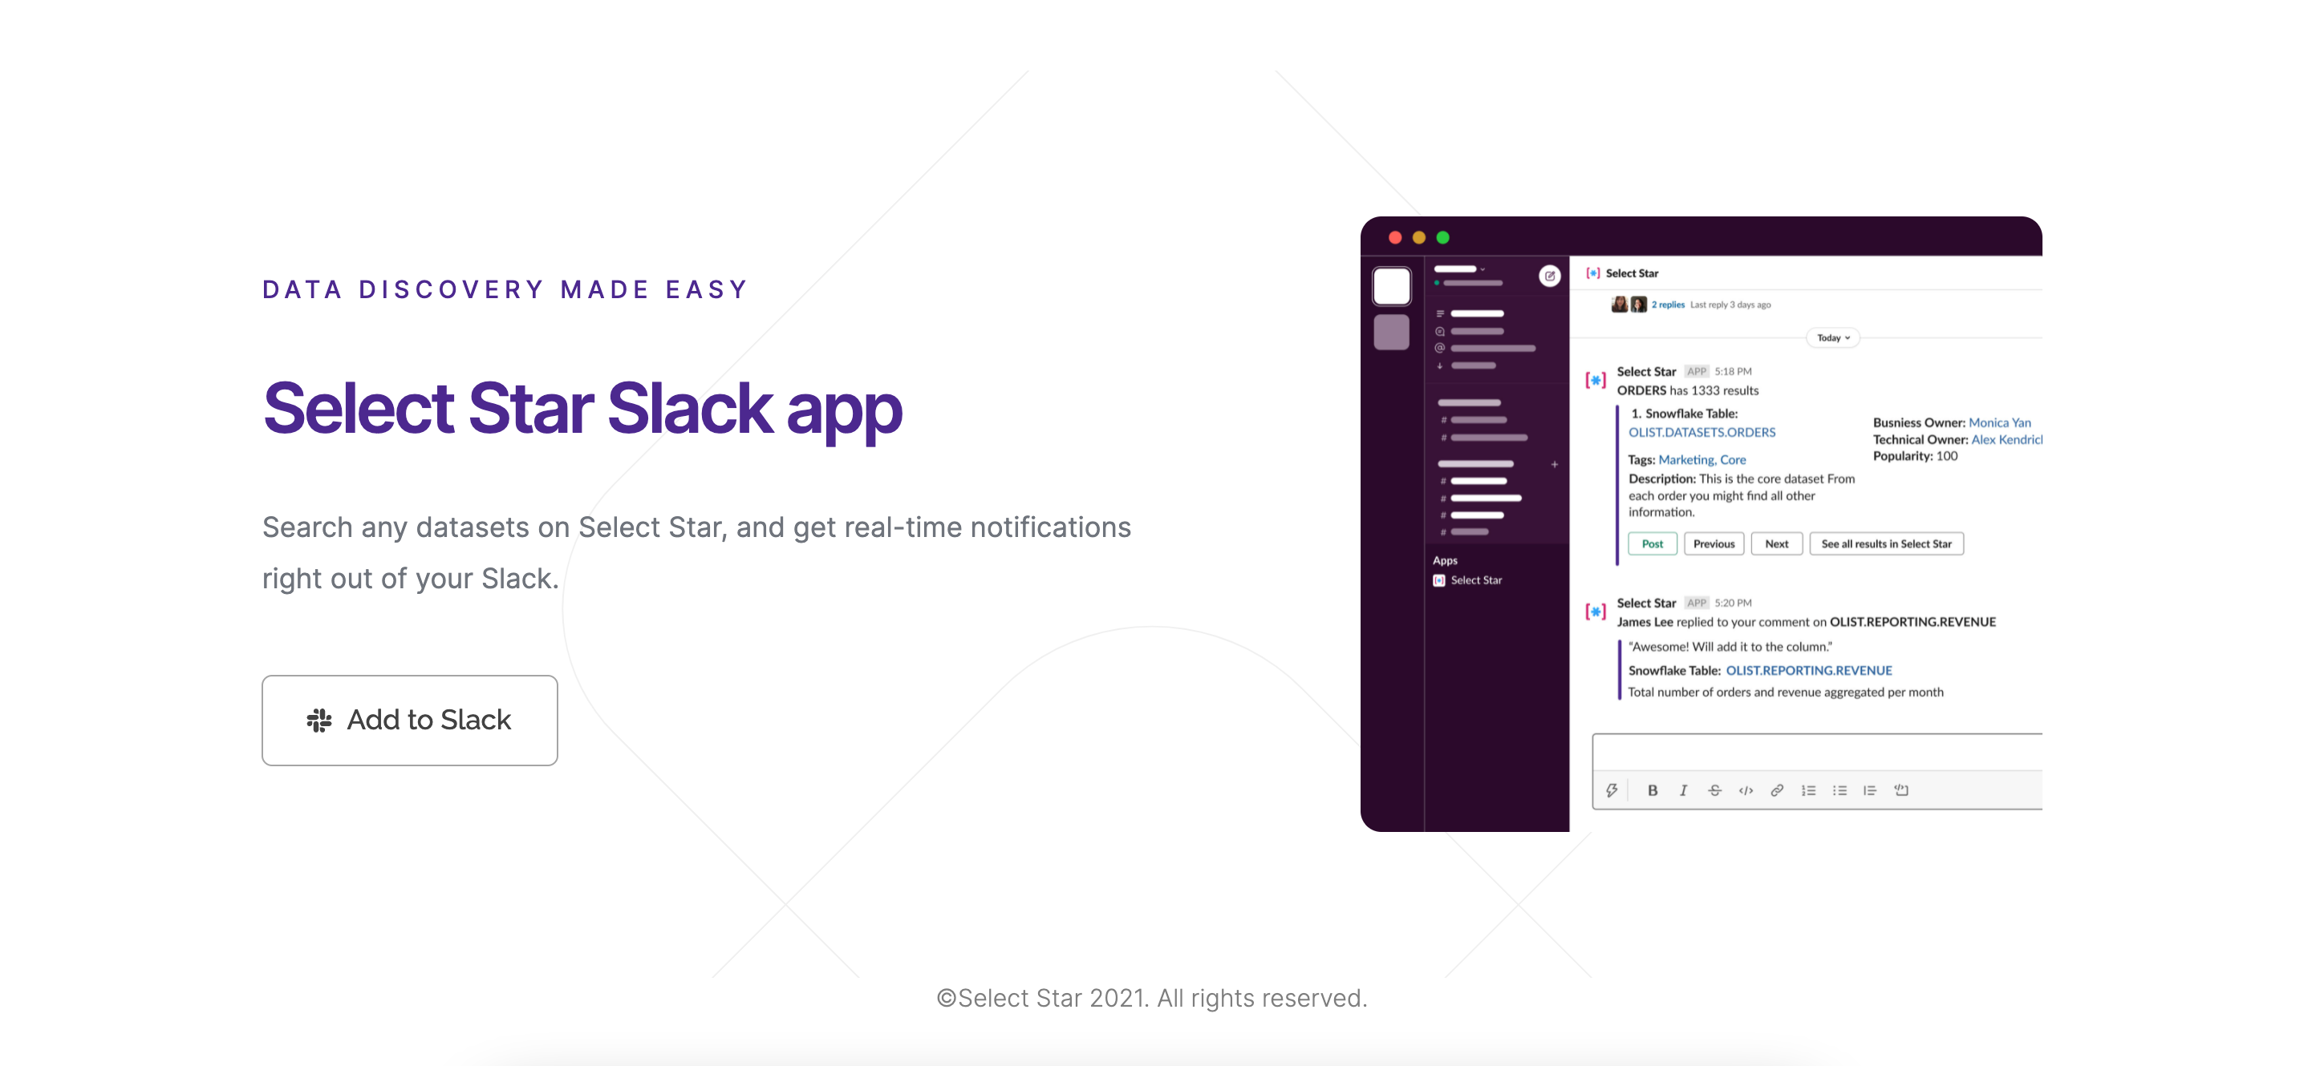
1. Slack App.
You can now use Select Star's search directly from Slack with our Slack app! You can share search results quickly with other members of your team and get Select Star notifications when comments on your datasets or tags you.
2. Client API (Beta).
The beginnings of our Client API are now available. If you'd like to use the API to write metadata back to your Data Warehouse or BI tools, please reach out to us so we can enable it for you! Then you'll be able to check out our docs to learn how to get started.
We'll be adding lots of functionality to this API, so please stay tuned for new endpoints in the coming weeks!
3. Data Source User page.
Data Source Users - people in your organization who have accounts on your Data Warehouse or BI tools - now have dedicated pages in Select Star, even if they do not have Select Star accounts.
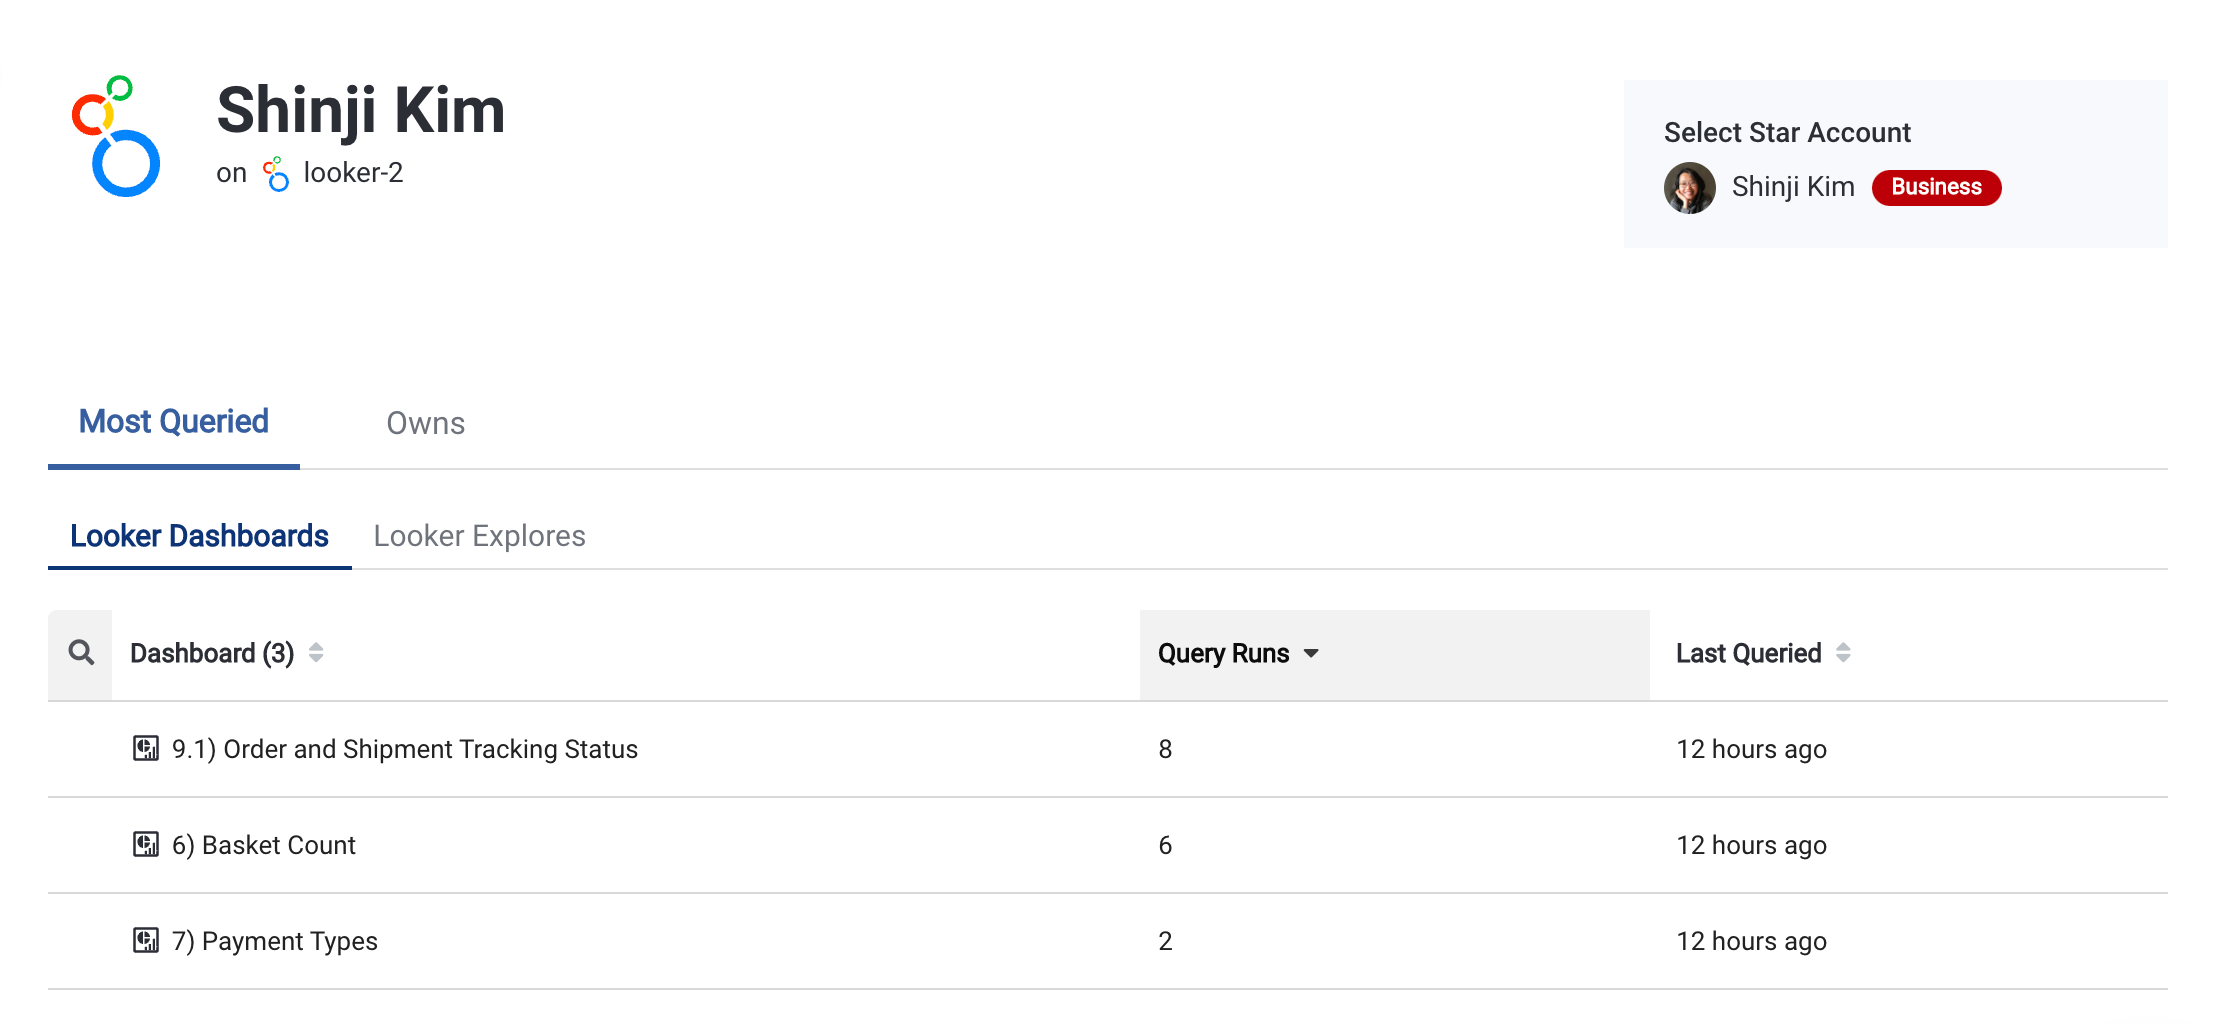
You can see which datasets a user queries most on that tool under the Most Queried tab. You can also find any datasets the user has created in a tool under the Owns tab.
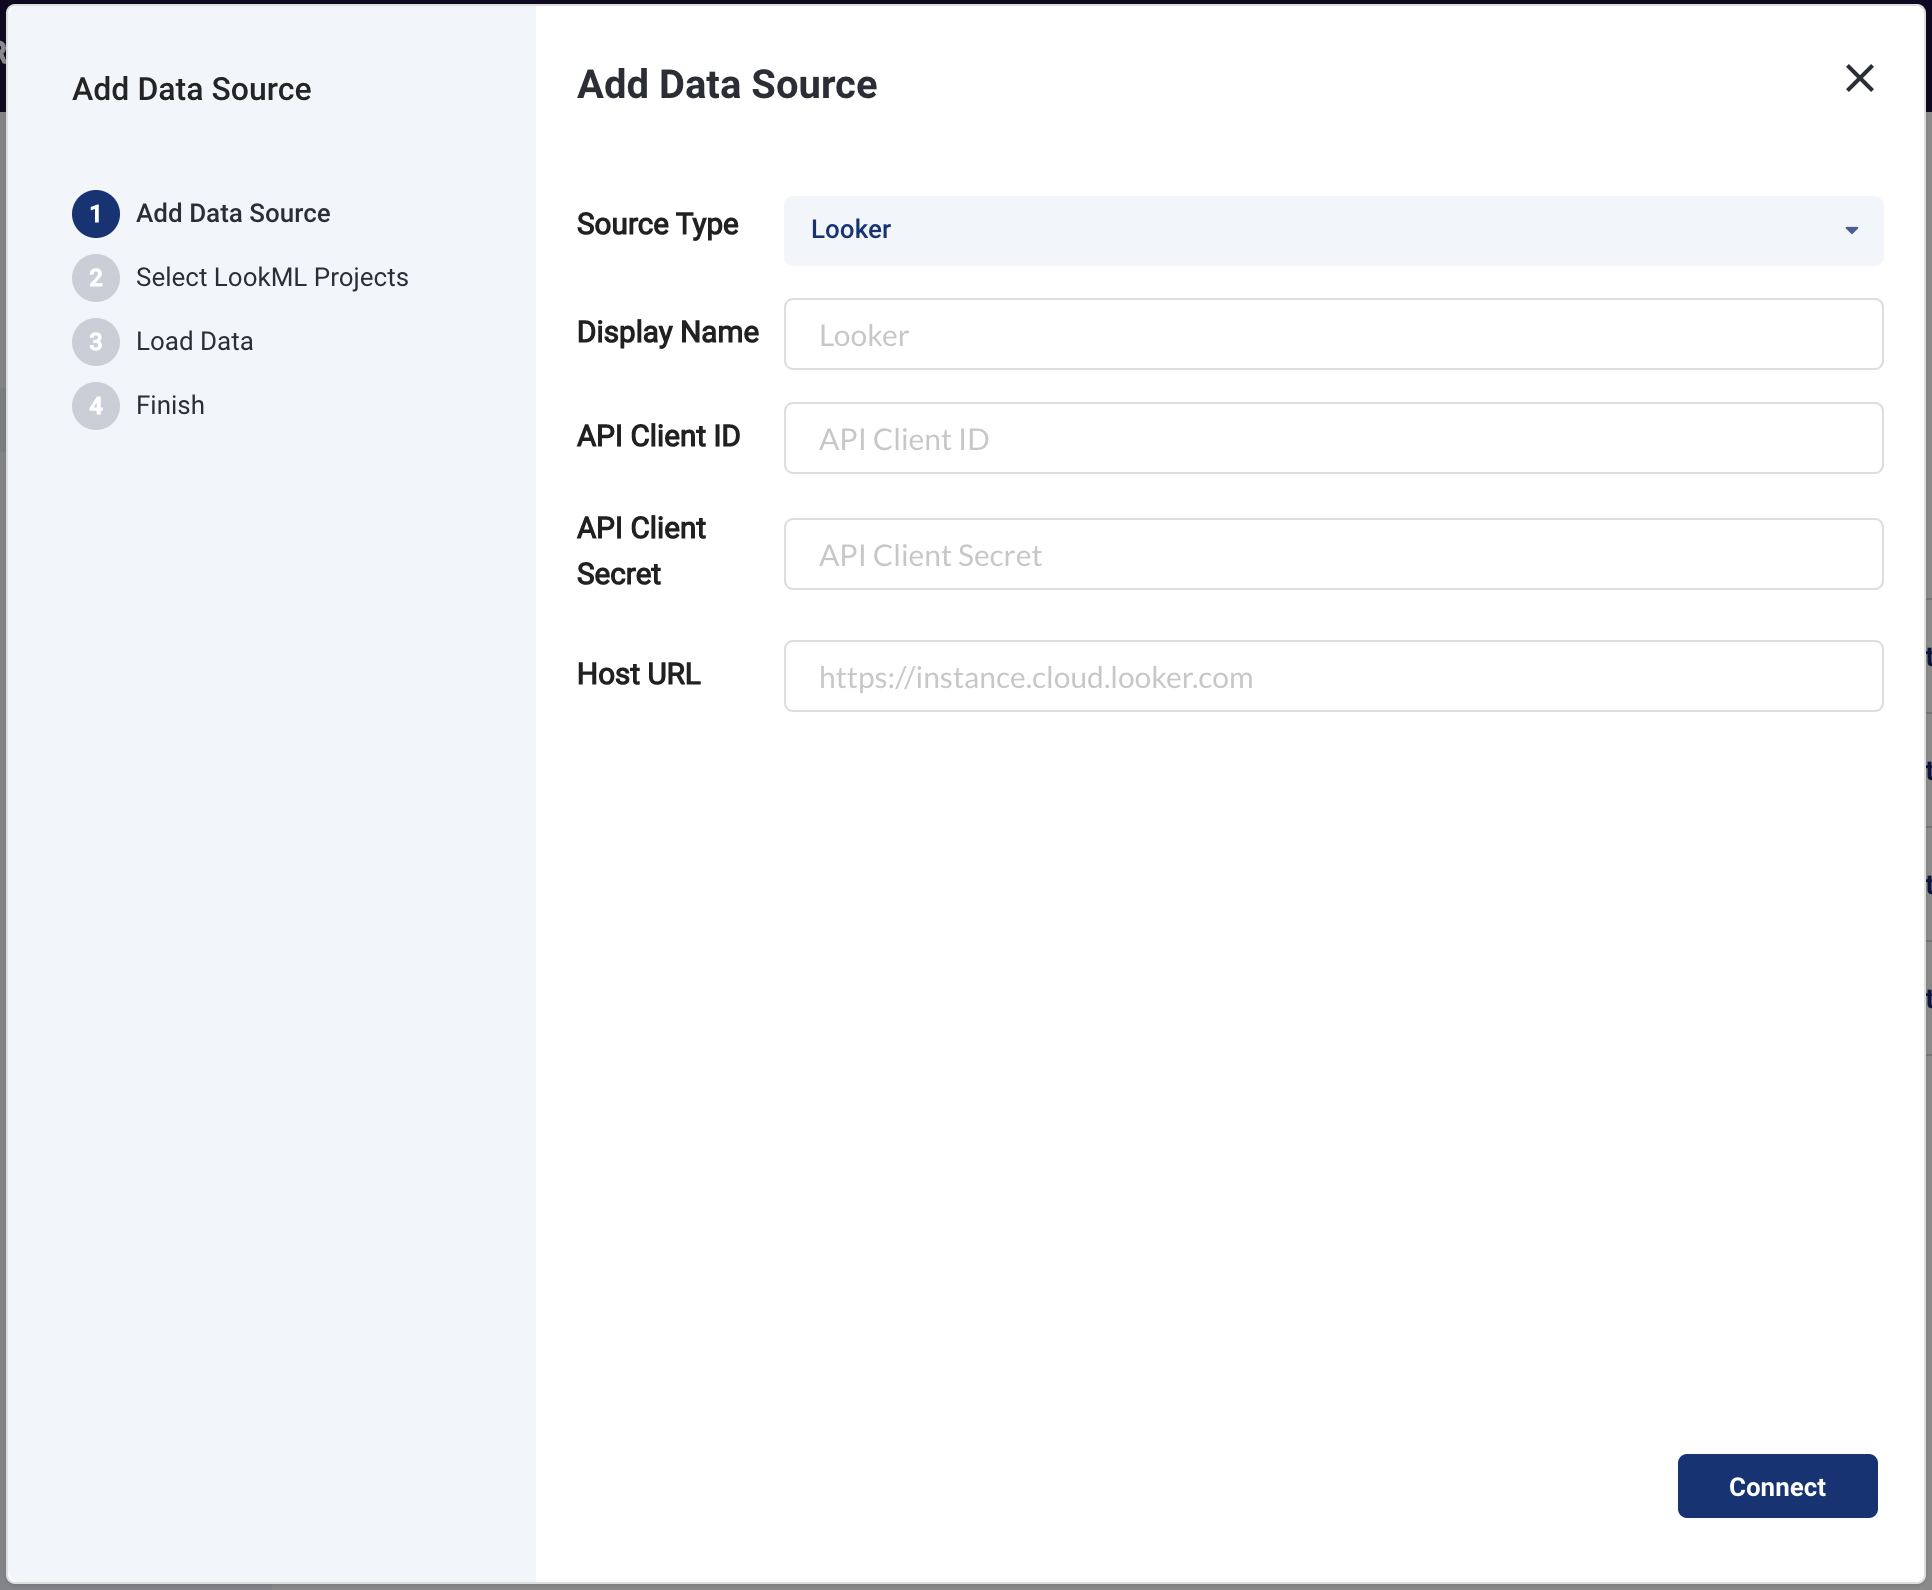
4. Looker integration is fully self-serve.
You can now add Looker metadata and LookML for lineage to your Data Warehouse through the UI. Check out our docs for more information.
September 20, 2021 - What's new in Select Star
1. Intercom Support.
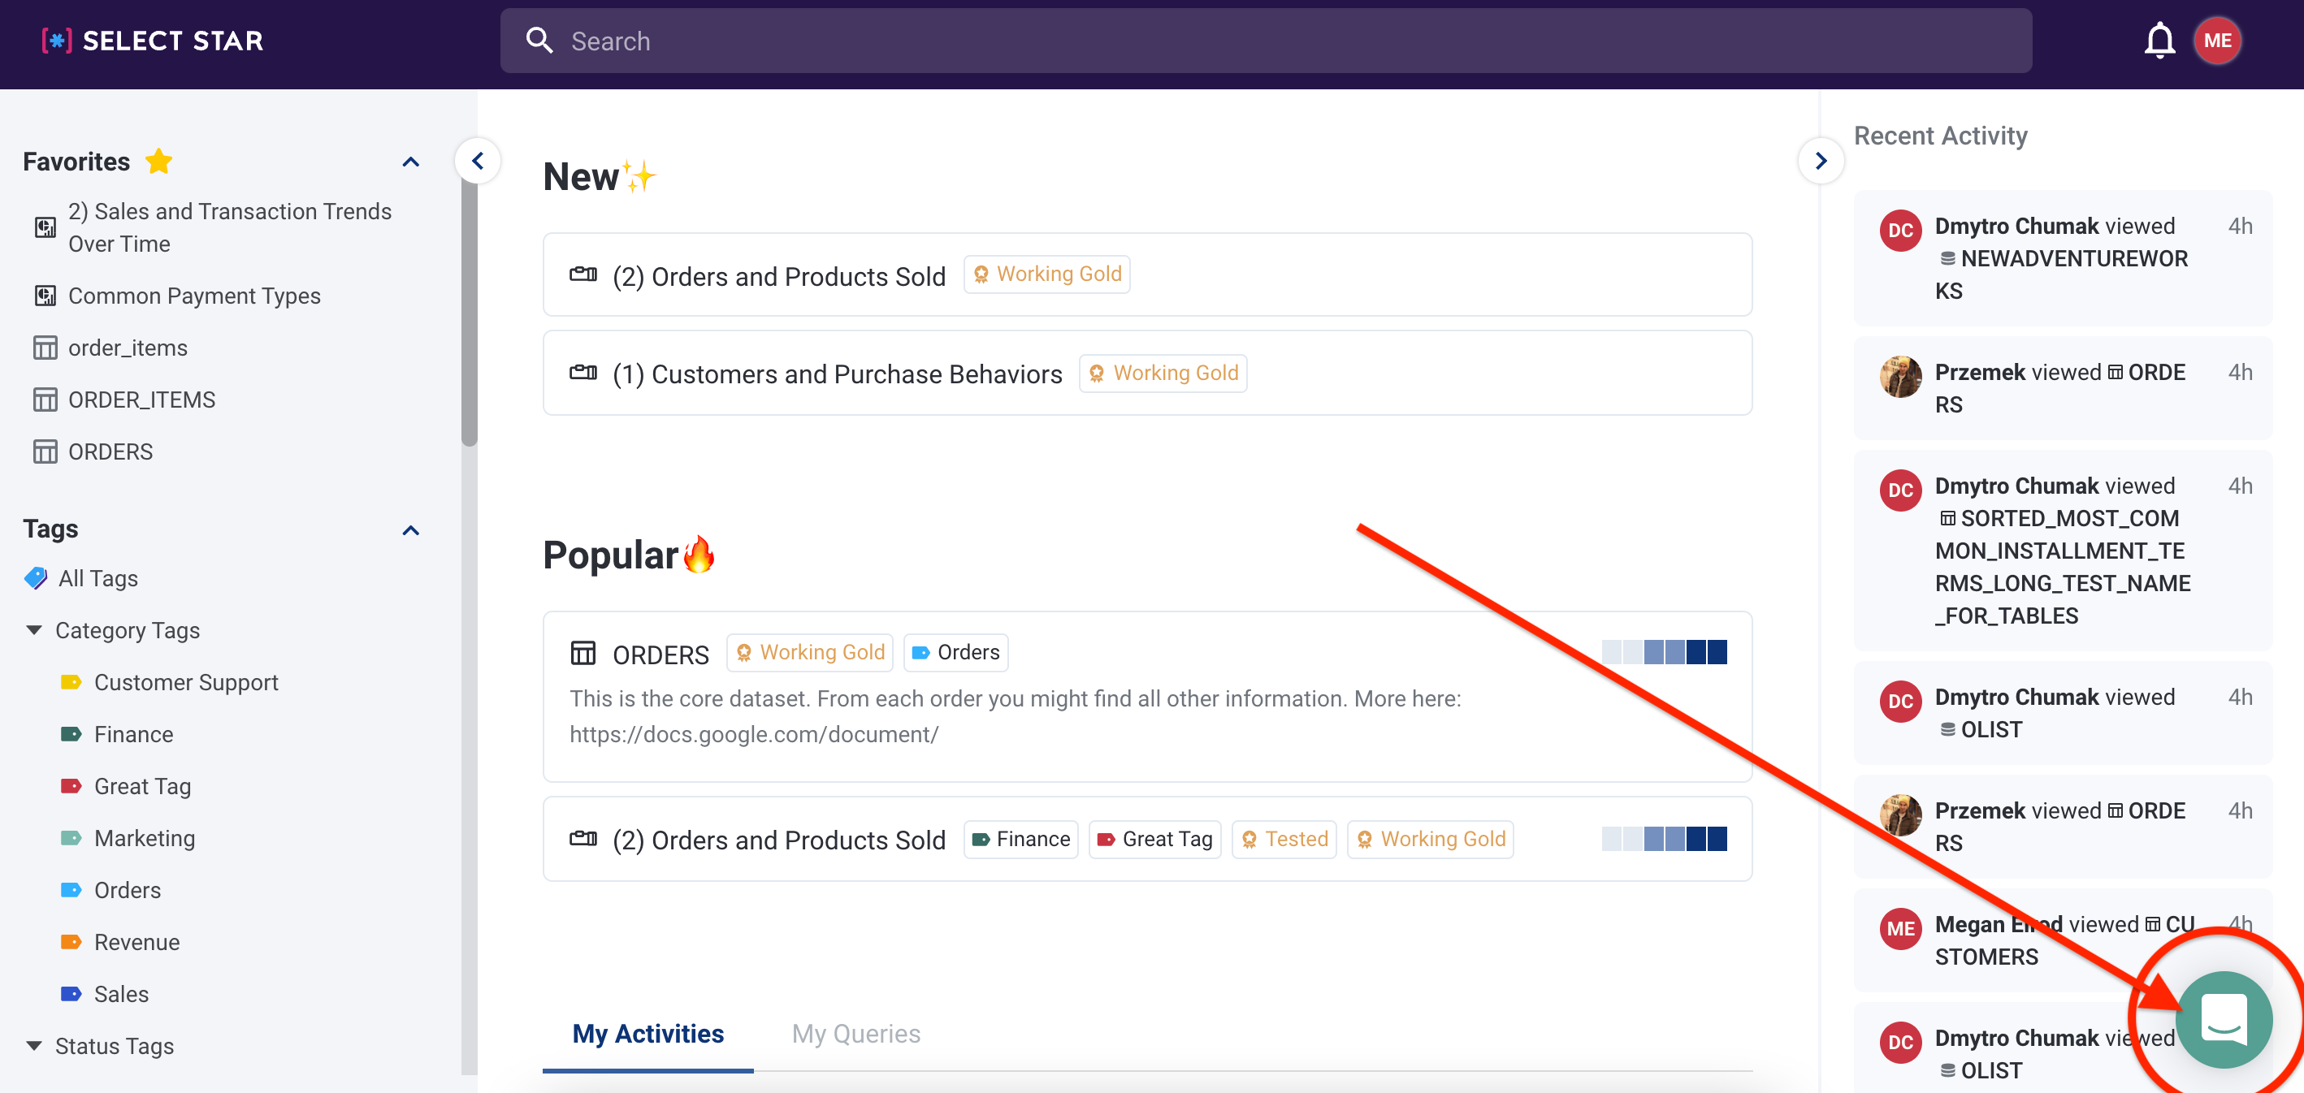
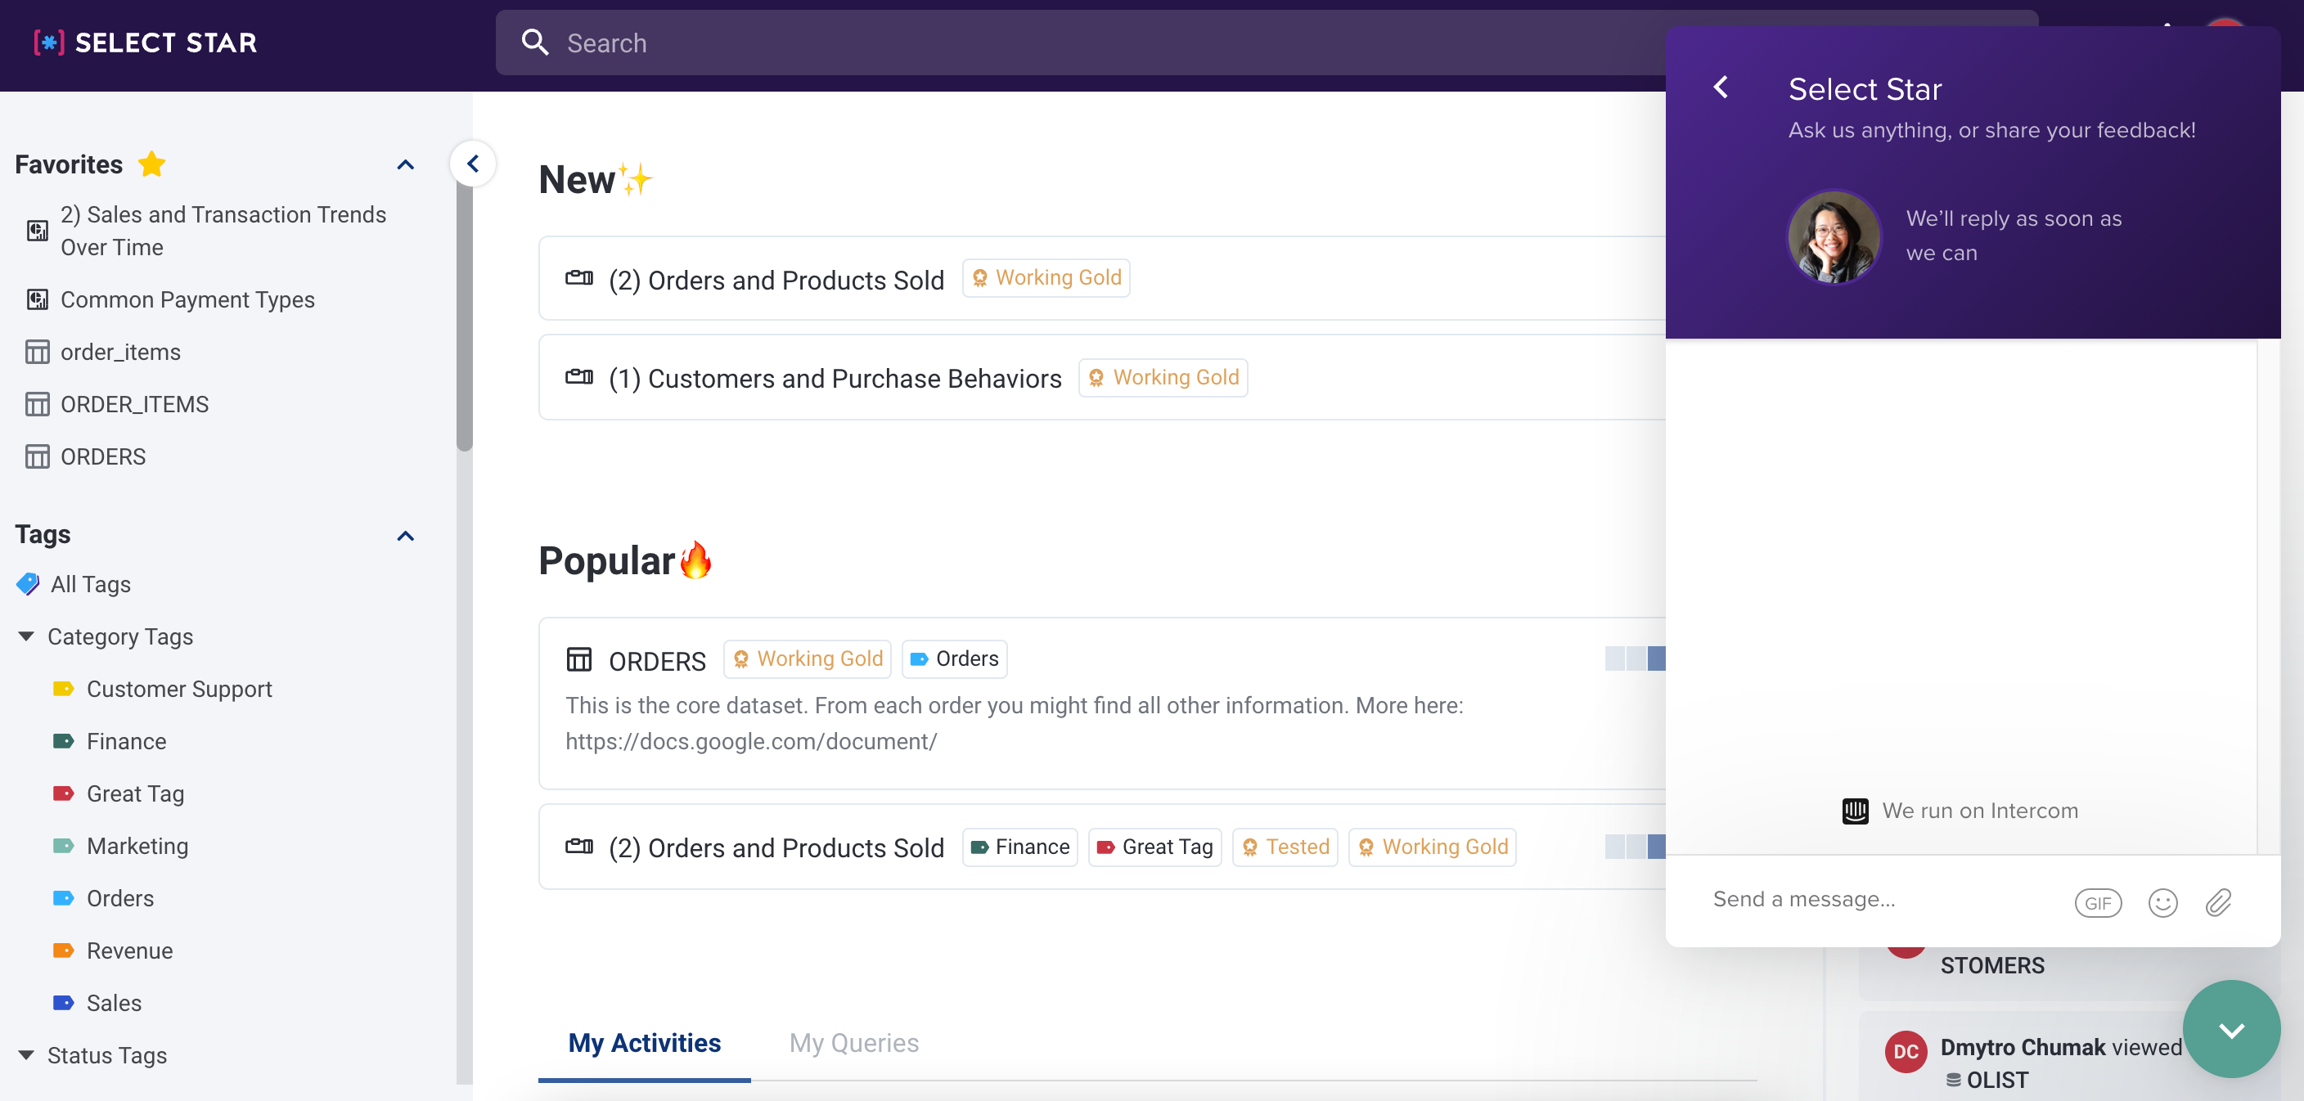
Are you having trouble navigating our platform? Or looking for data or a feature you can't find? We've added Intercom to our platform so you can contact a Customer Support representative directly with questions.
Click the chat icon in the bottom right corner to send us a message and we'll get back to you as soon as we can.
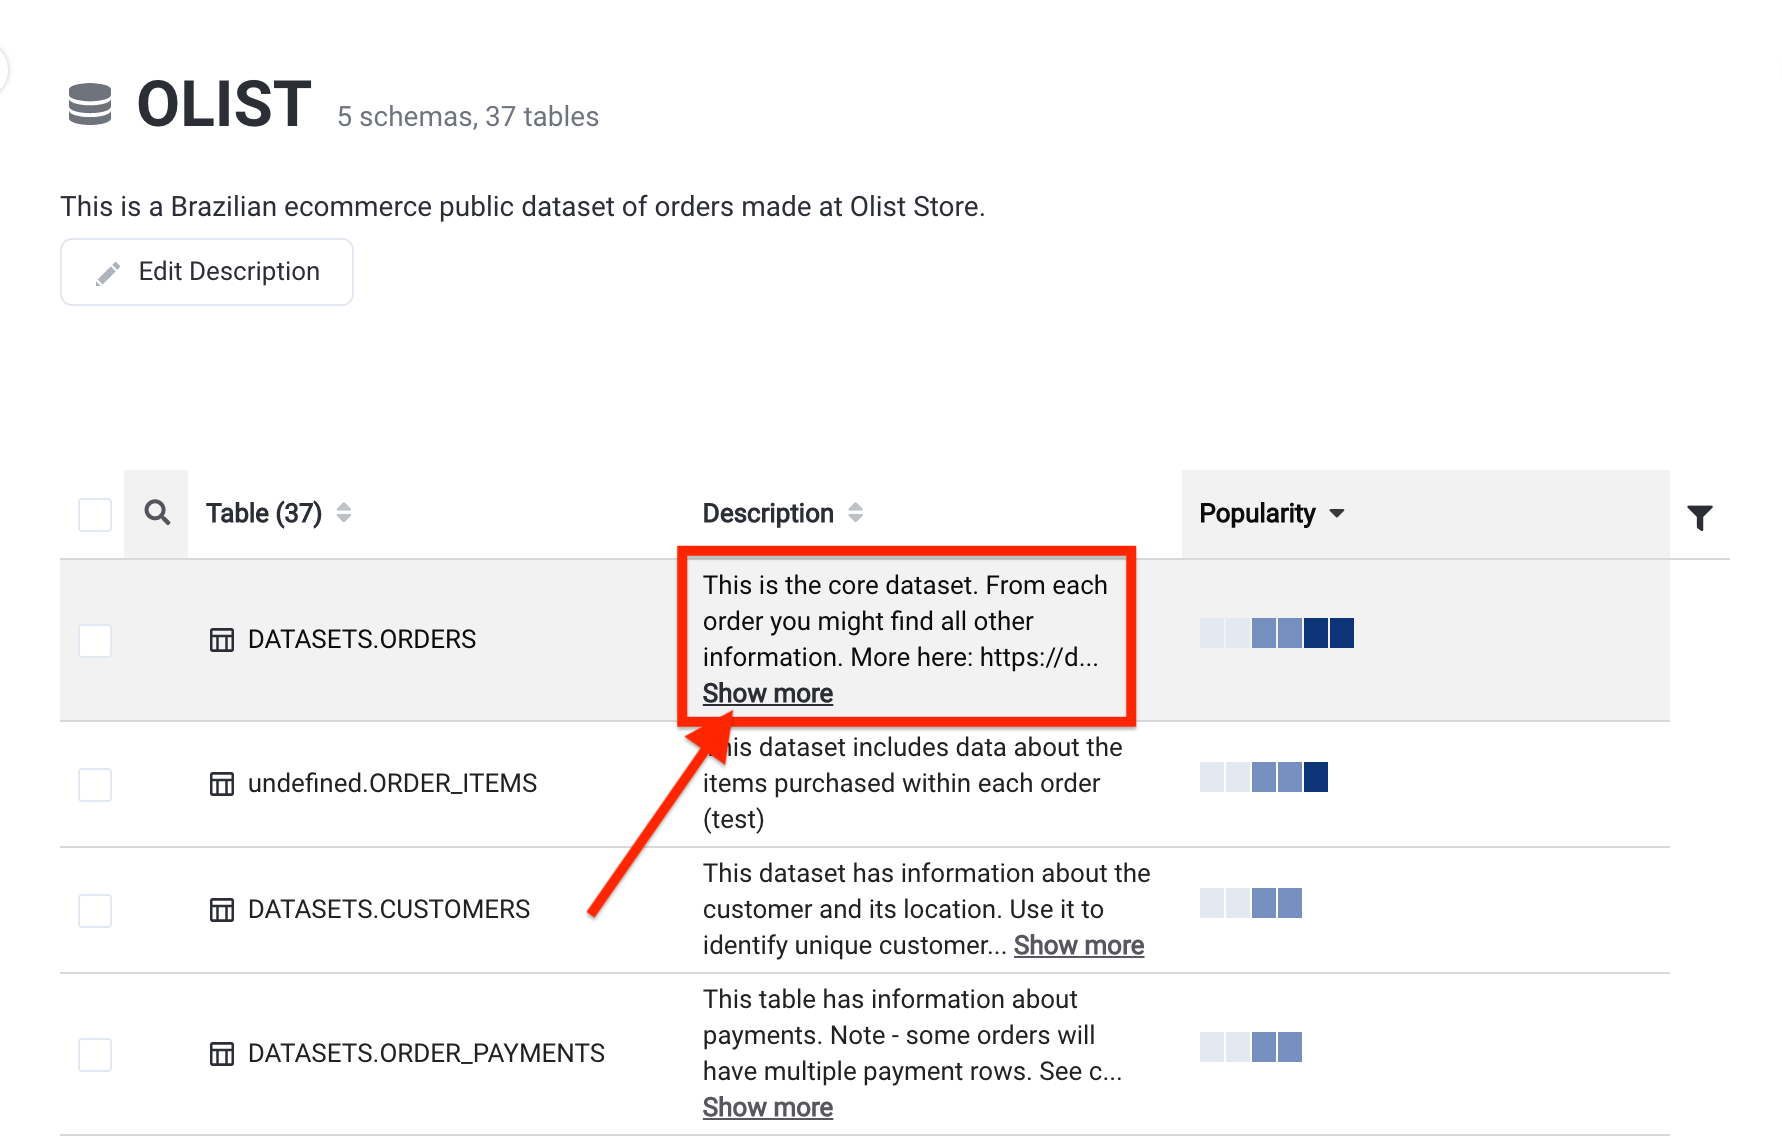
2. Expandable descriptions.
Descriptions are now shortened by default to make it easier to browse through your tables, reports, columns, search results, and more. You can click Show more to see the full description, and Show less if you want to make more space on your page.
3. Search results page filters.
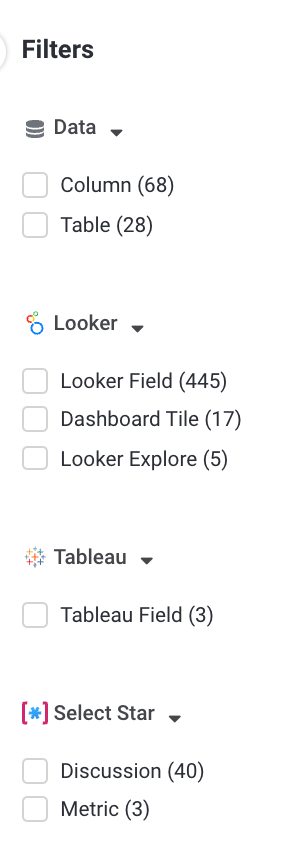
Filters on the search results page are now grouped by data source.
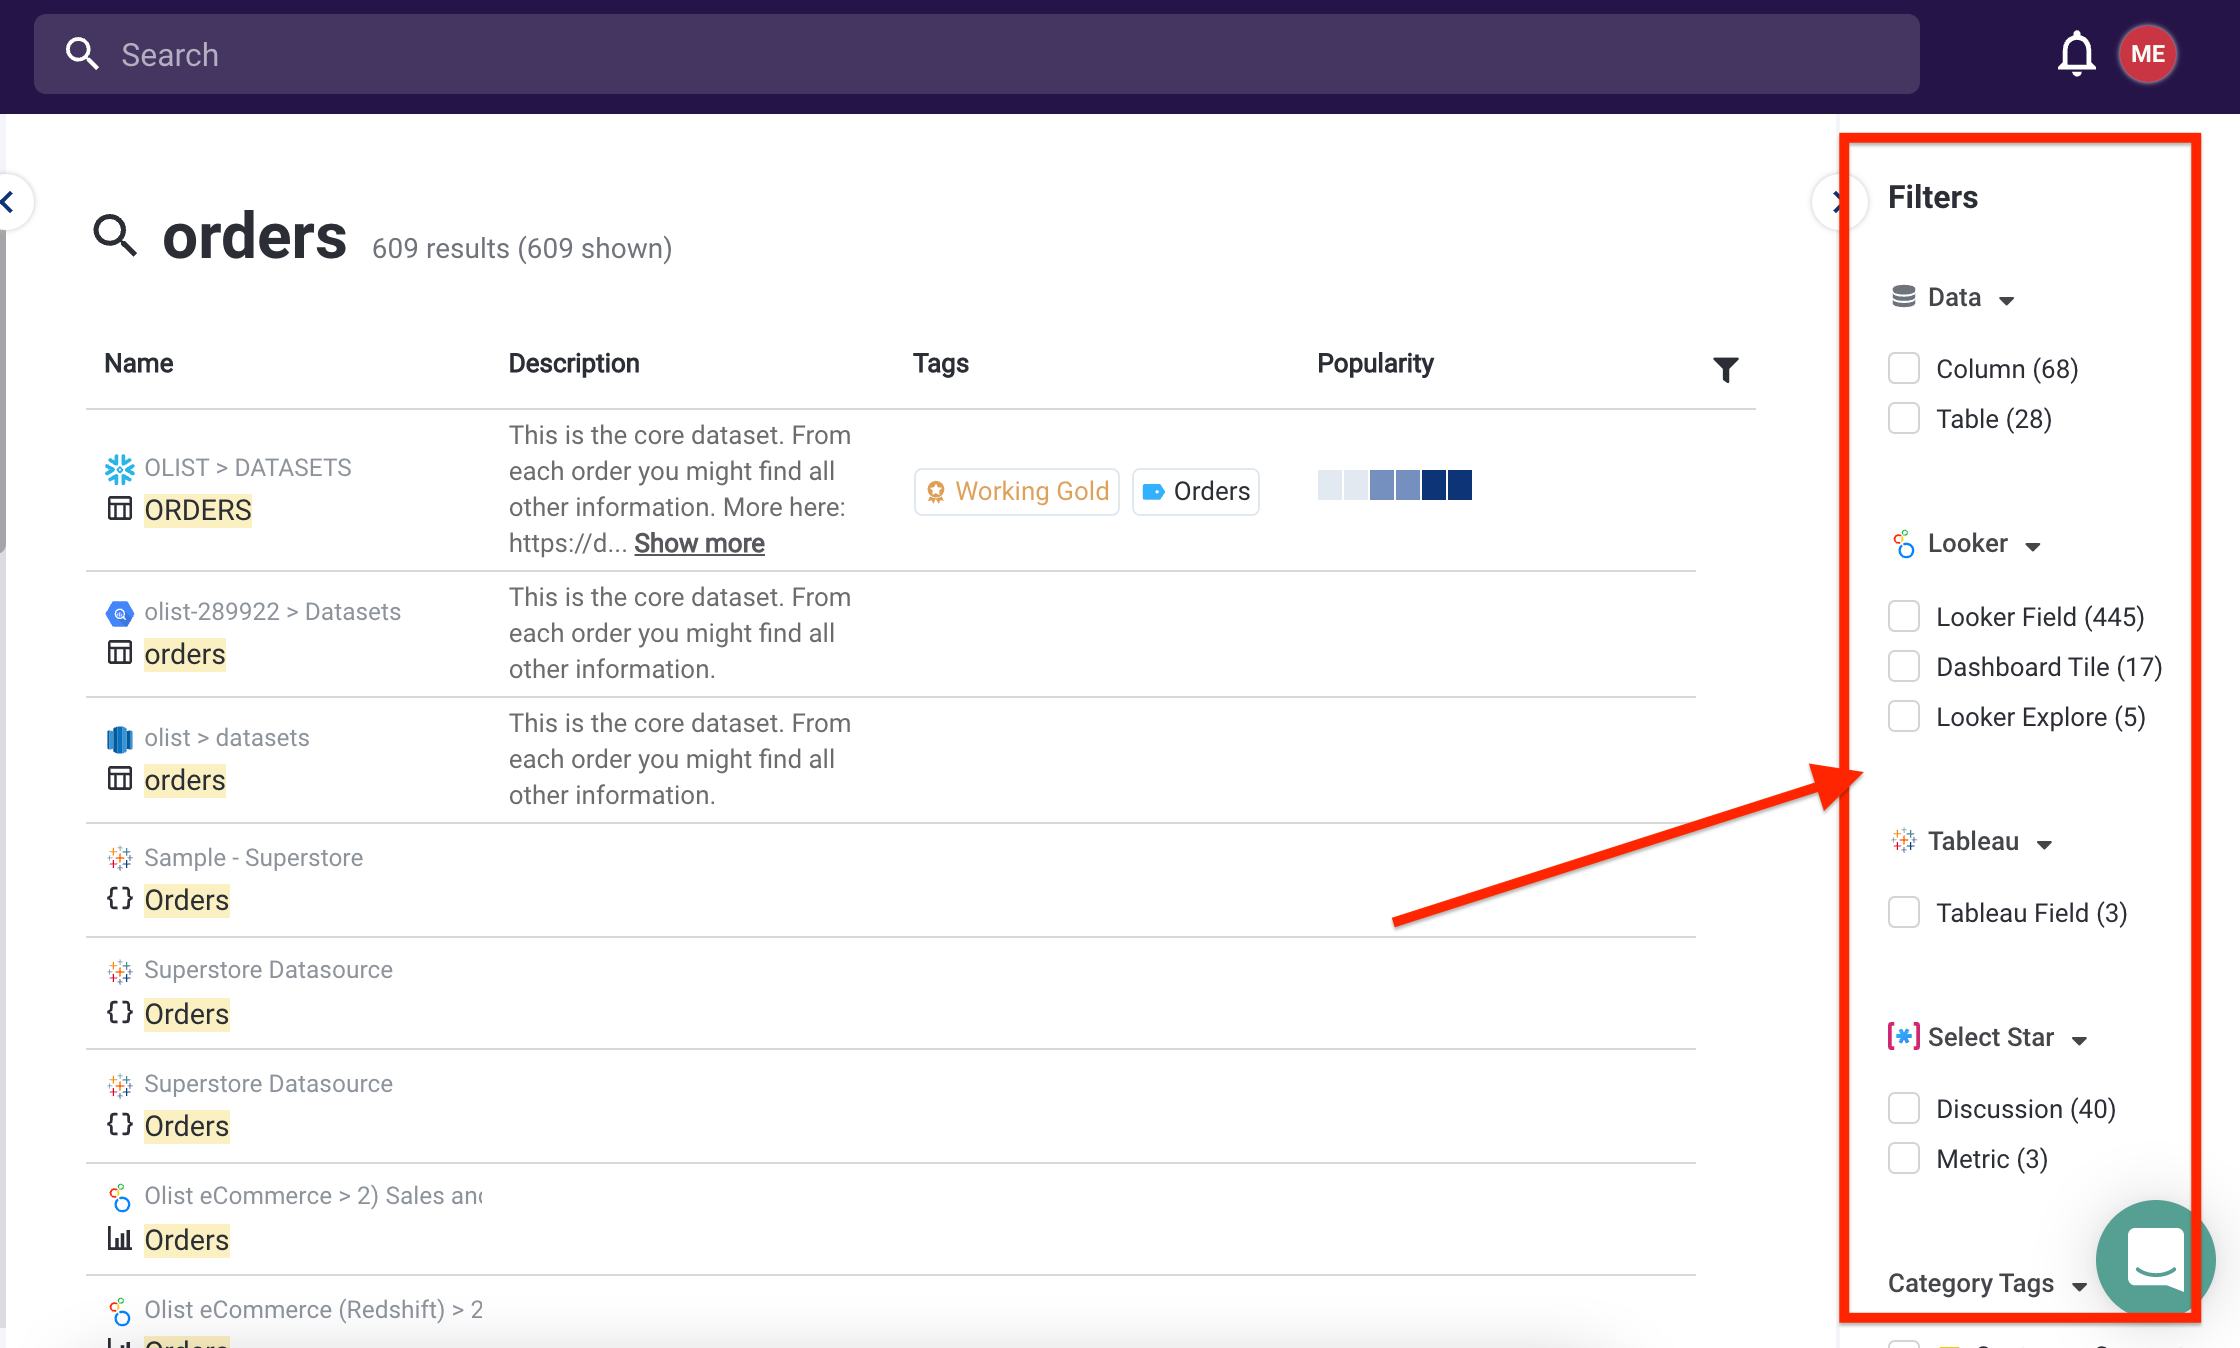
Any data source that returns results will show up here, as well as Select Star-specific items, like Metrics or Discussion comments.
Filter by Category and Status tags like you would from a database or BI tool page...

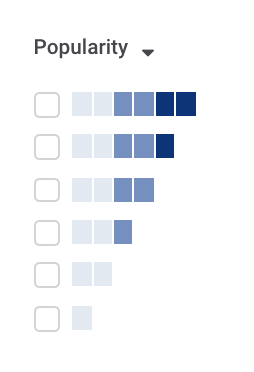
...Or find items with a certain level of popularity.
September 10, 2021 - What's new in Select Star
📖 1. Select Star User Docs:
Select Star user docs are now available at https://docs.selectstar.com/! Explore common data workflows in Select Star and in-depth explanations of features.
We'll be continuously updating the documentation in the coming months. Please let us know if you have any feedback or documentation you want to see!
💻 2. Select Star API (beta):
We have an API! This is designed so that you can programmatically read and write metadata to/from Select Star. Give it a try: https://docs.selectstar.com/select-star-api/overview
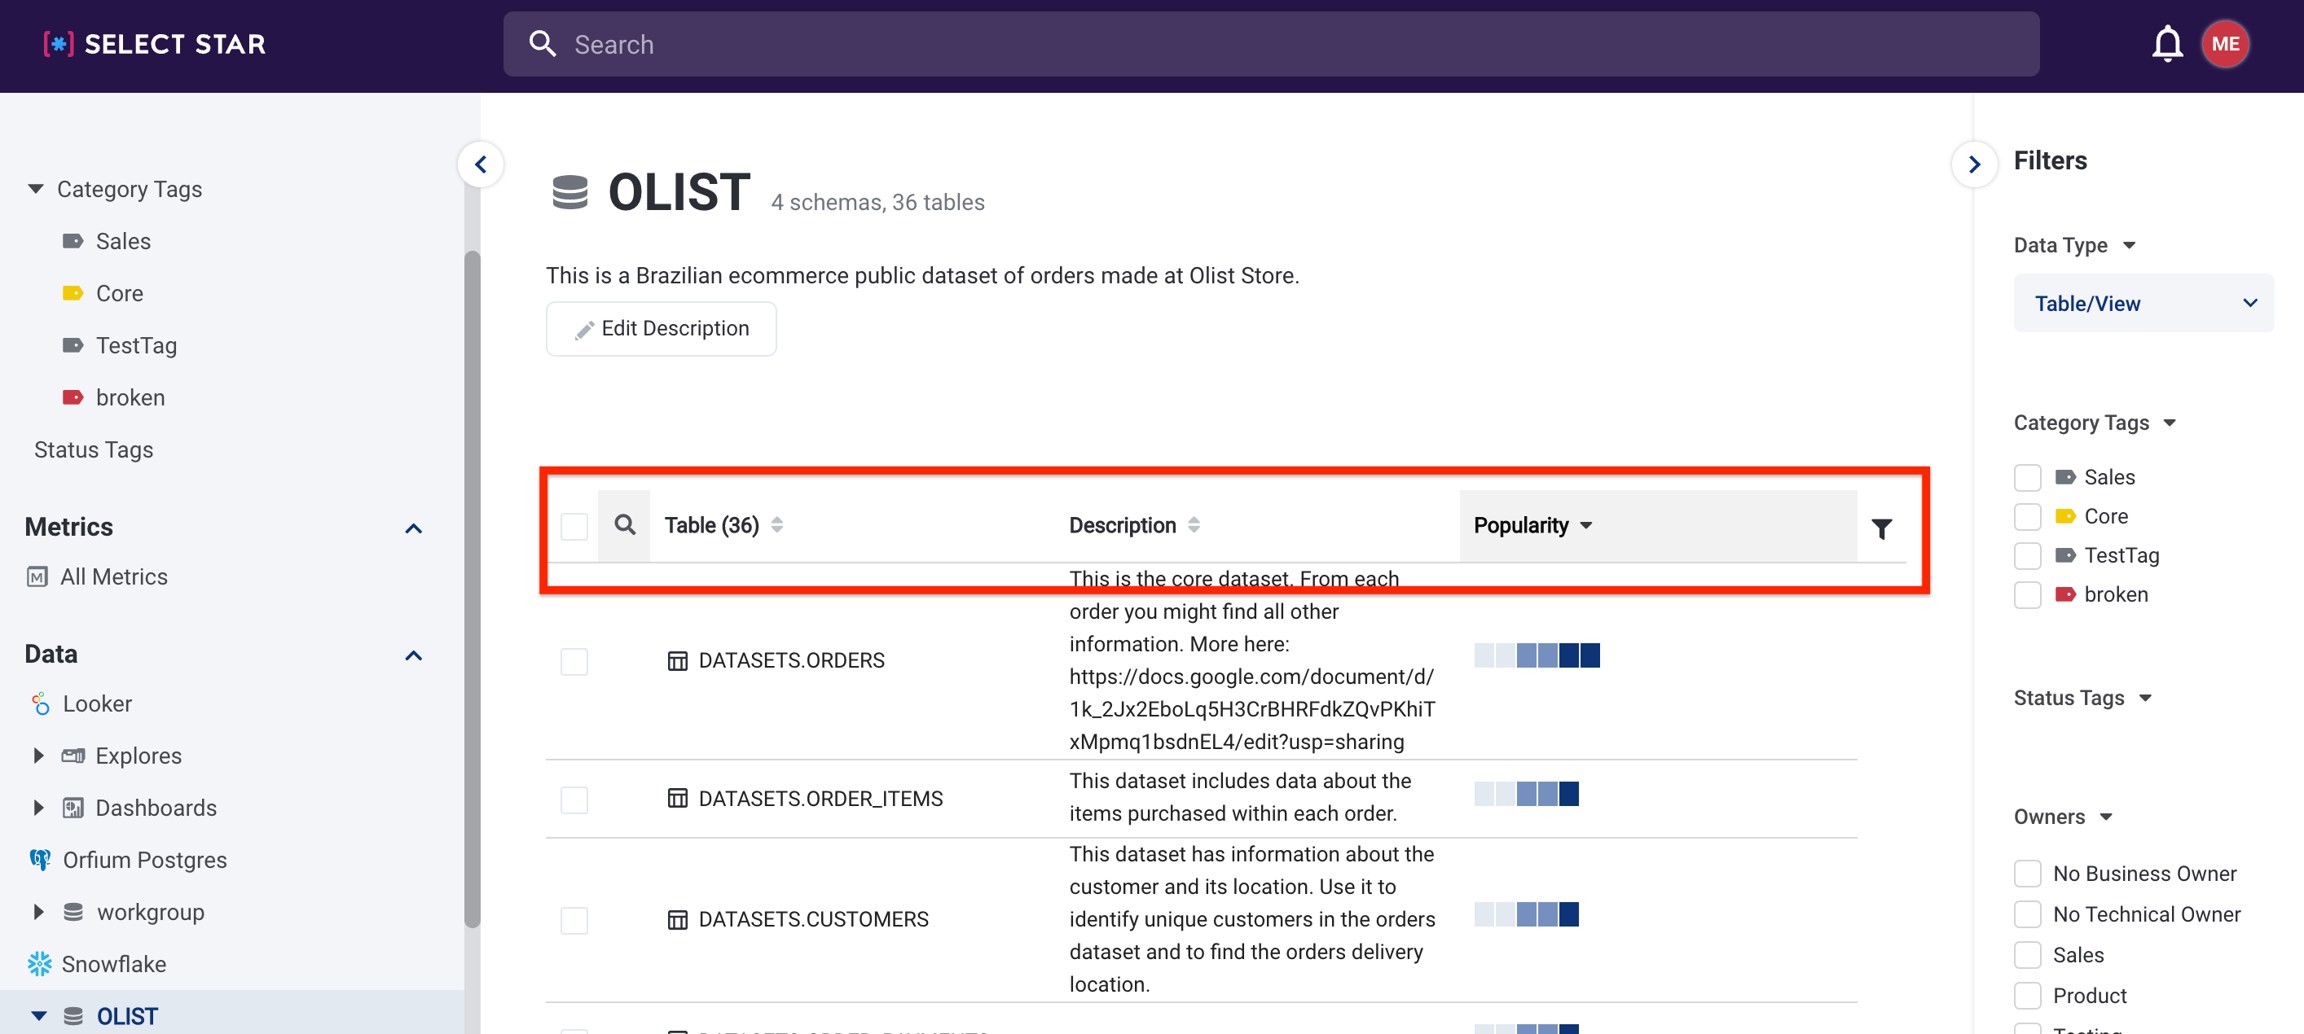
📌 **3. Sticky headers: ** Table headers all throughout the app are sticky now, so you can see column titles as you scroll down in a page.

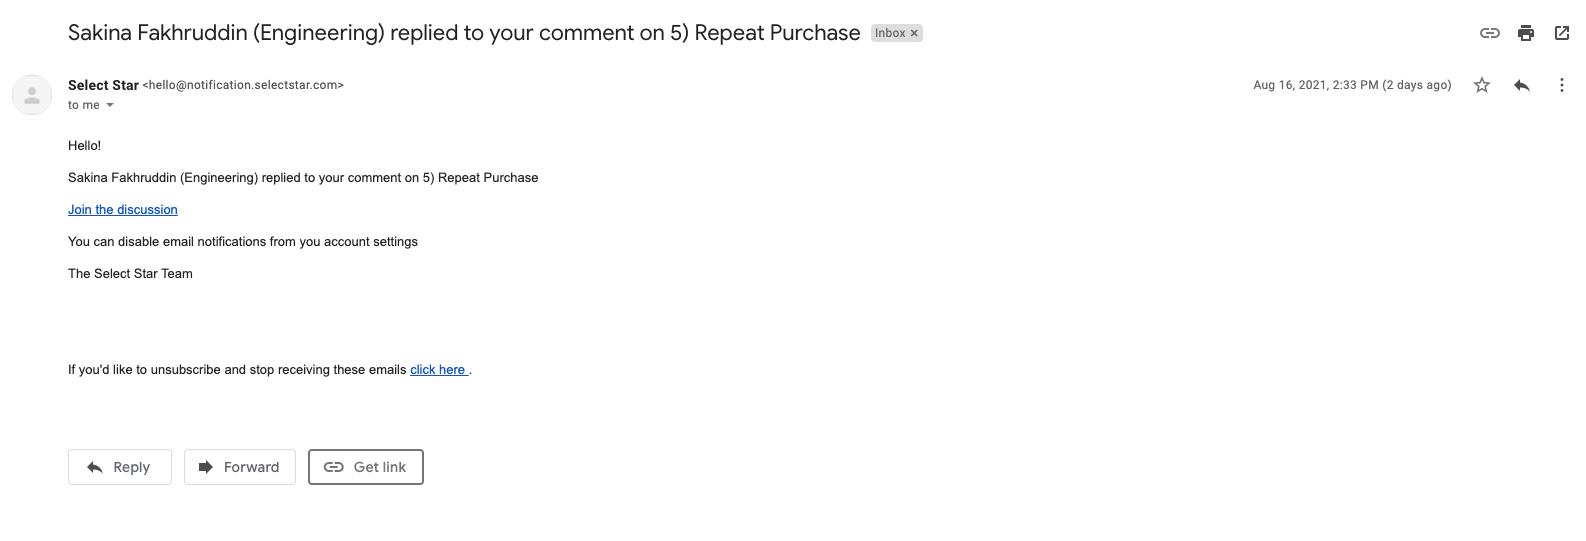
August 18, 2021 - Email notifications are here!
You will now get an email now if someone comments on one of your datasets, replies to a comment, or assigns you as an owner 🥳 🎉
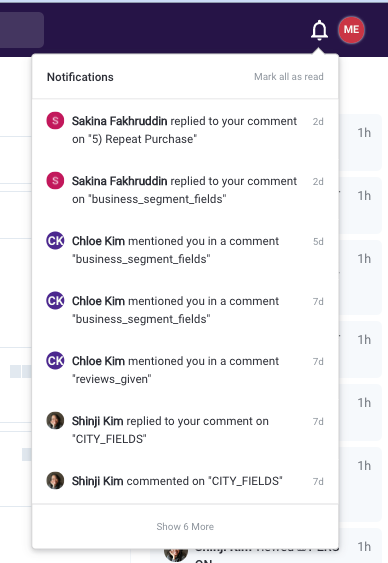
You'll still be able to see all notifications by clicking the bell 🔔 icon.
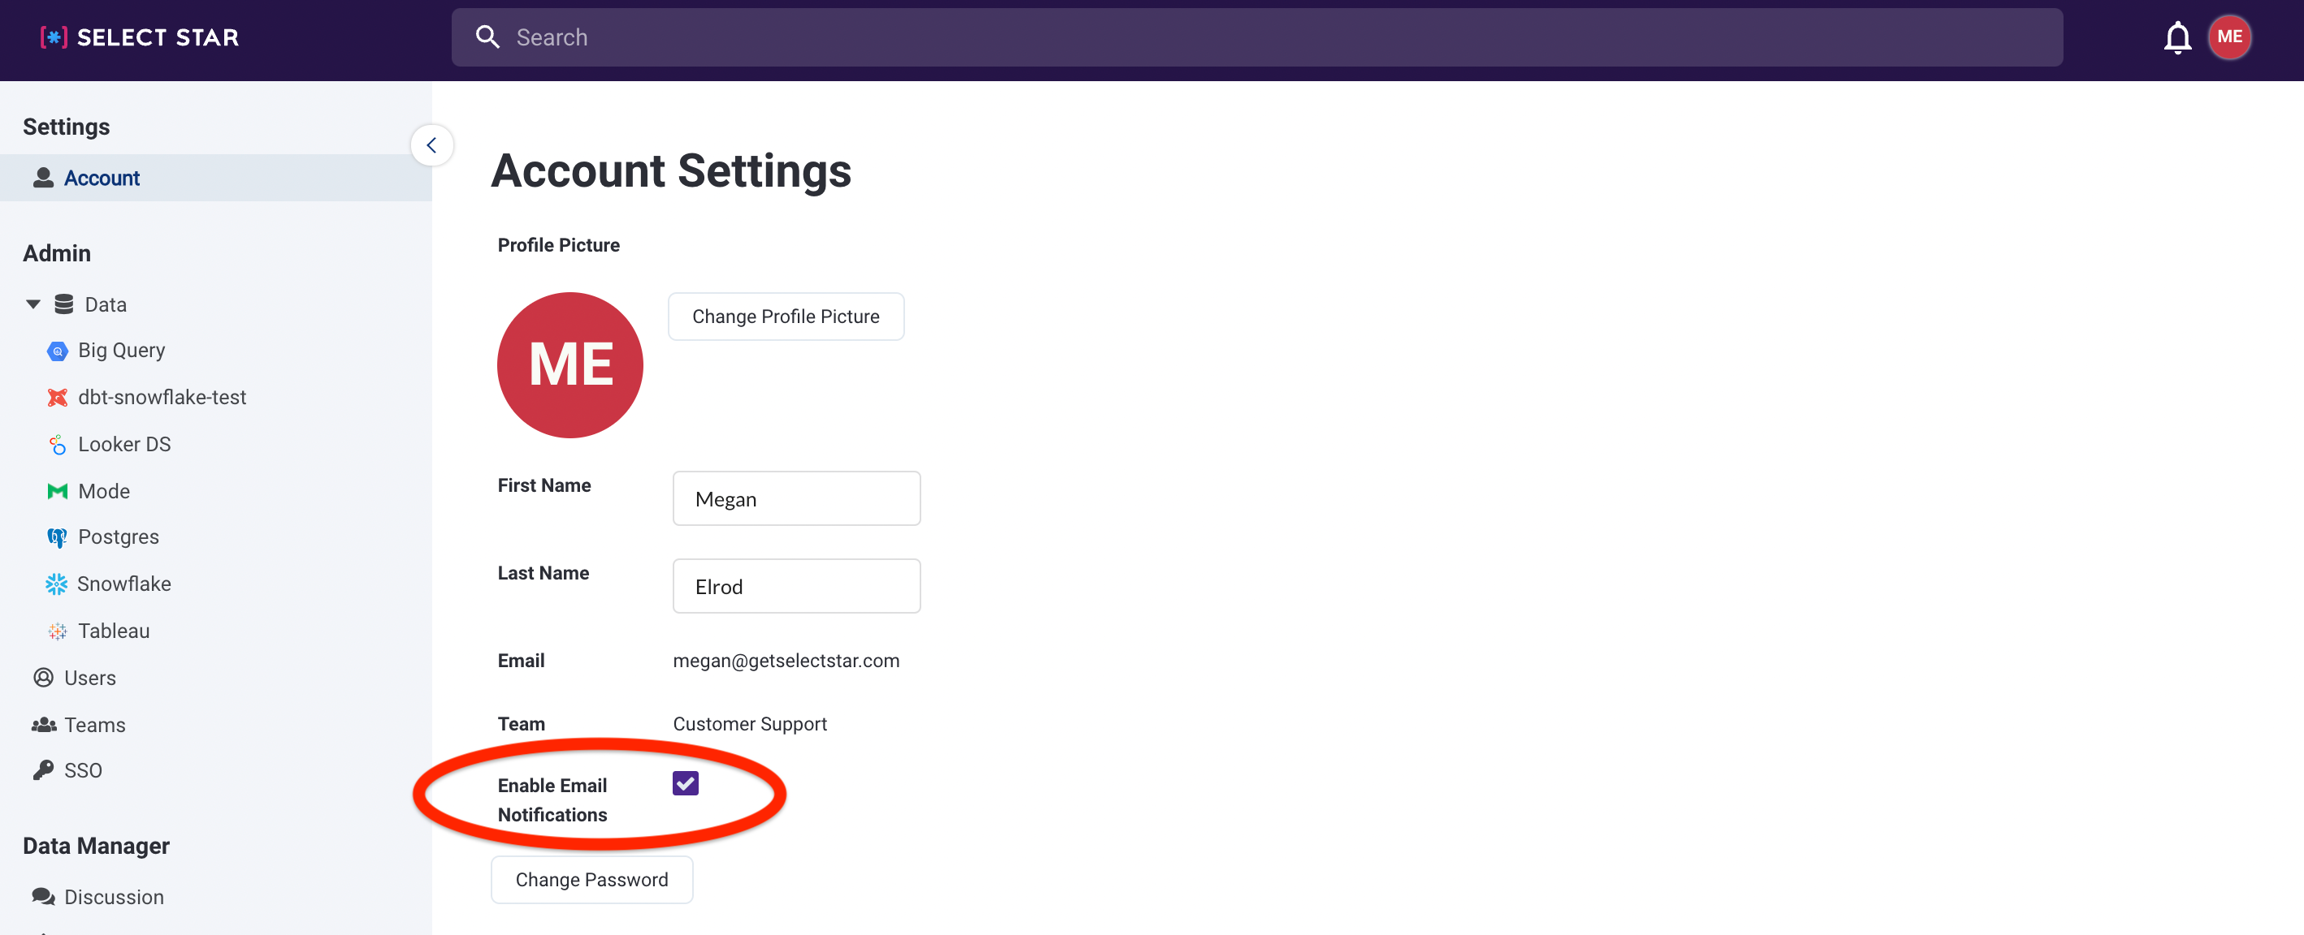
You can turn off email notifications in the Settings page.
August 3, 2021 - What's New in Select Star
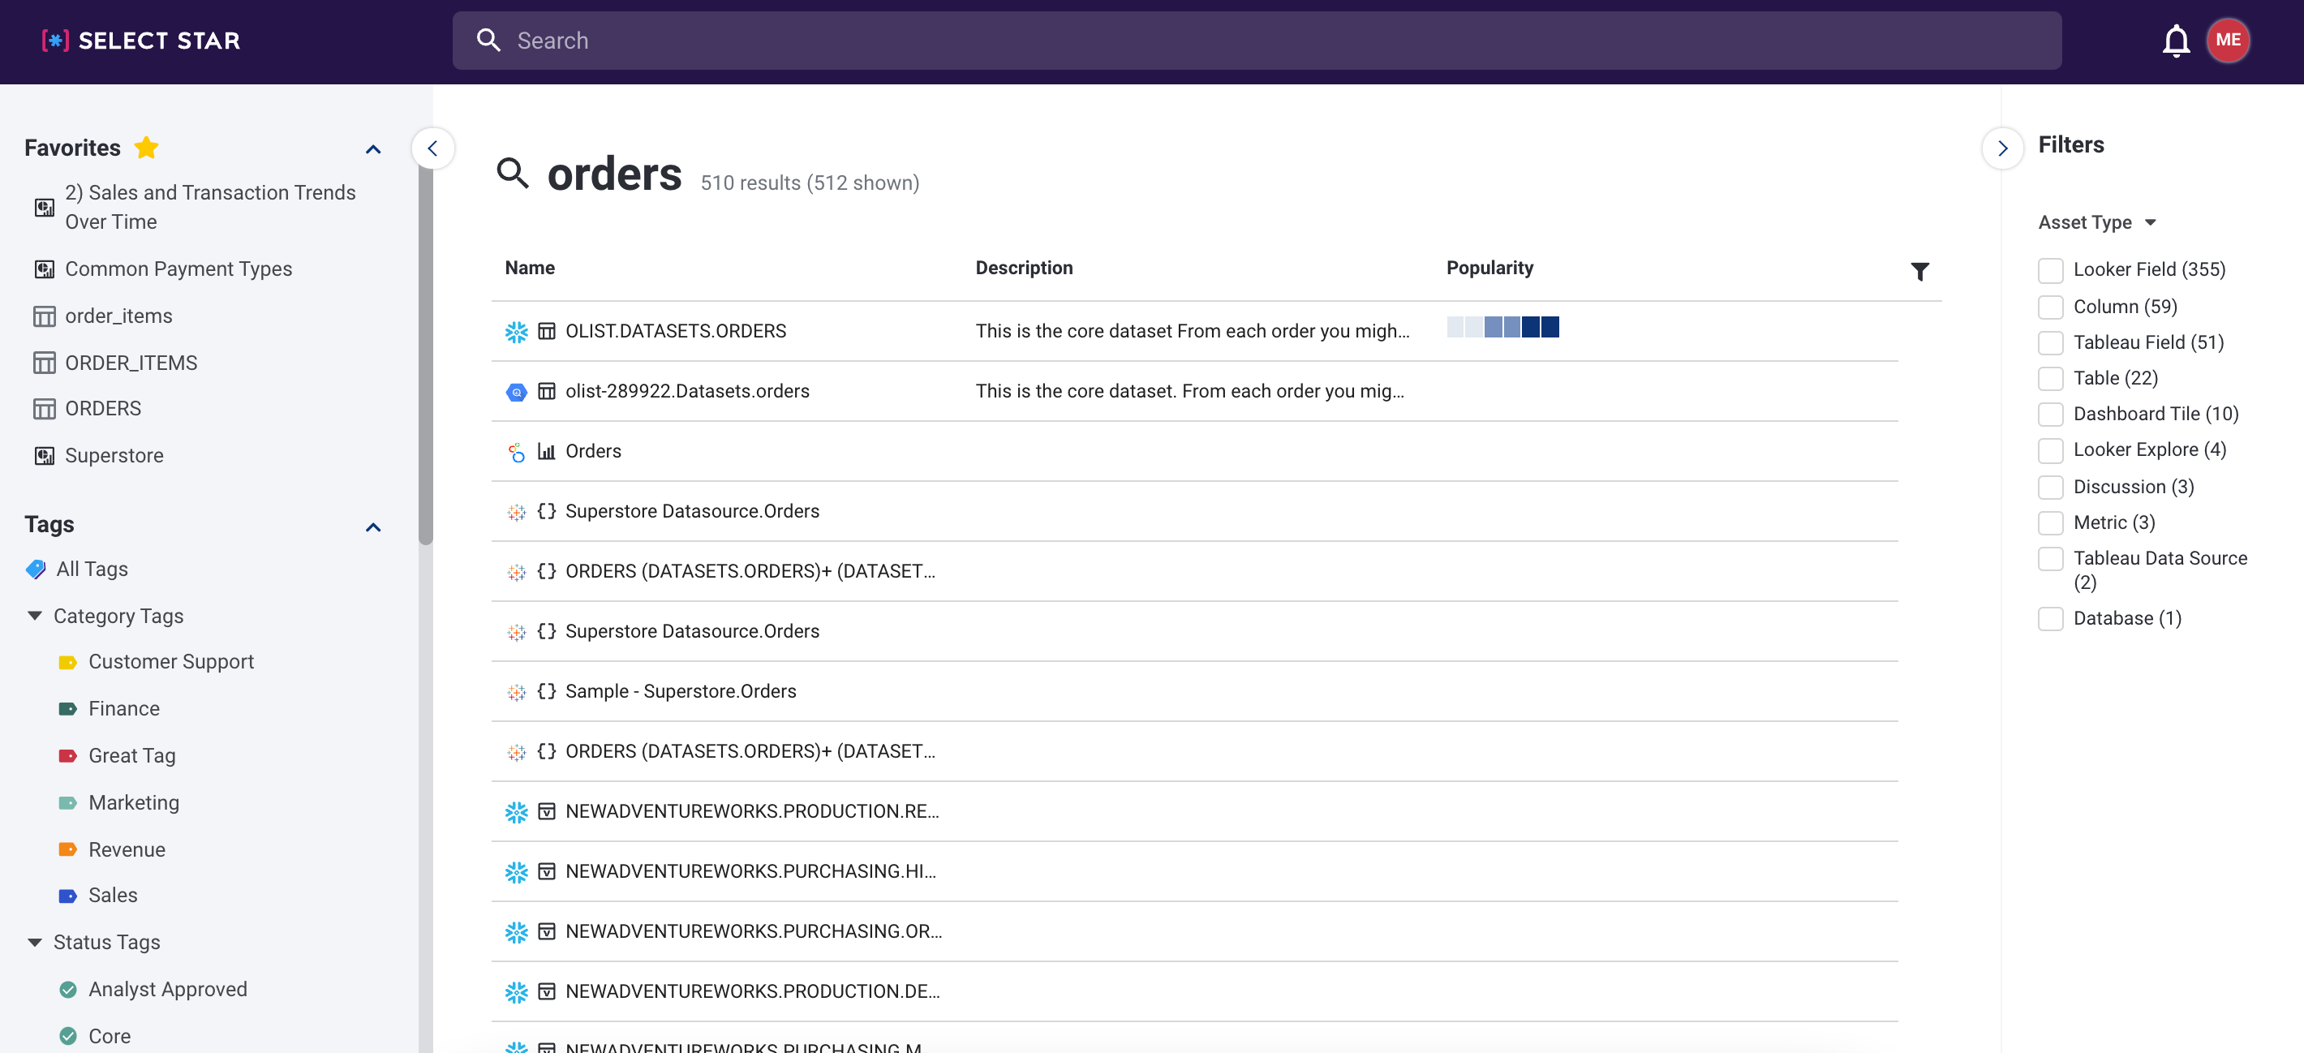
1. Search results page:
We’ve made it easier to browse search results by adding a Search Results page. From the top search bar, you can hit Enter/Return and see all the items returned by your search with more detail. You can also use the Asset Type filters on the right sidebar to refine your search.
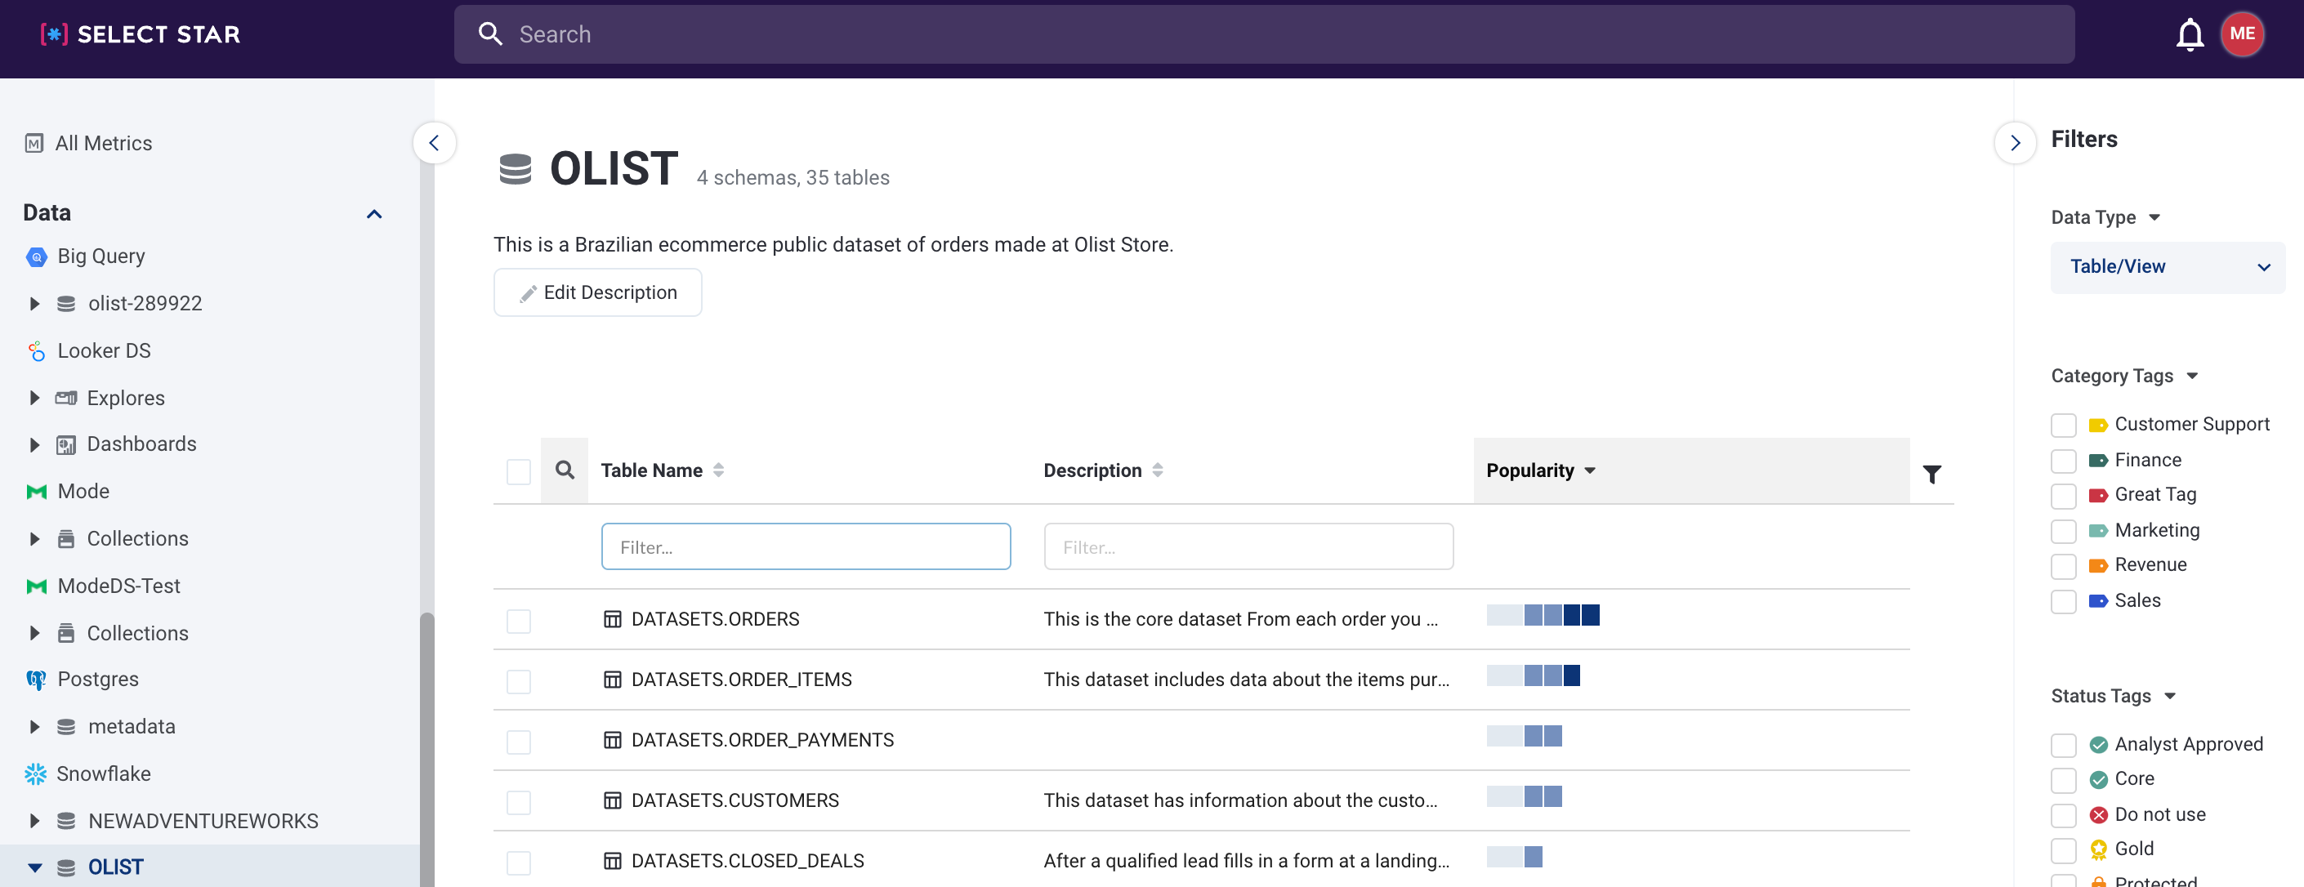
2. Keyboard shortcuts for page search:
Use the keyboard shortcut Ctrl/Cmd+F to open the Page Search bar so you can easily search inside of top level Data Source views!
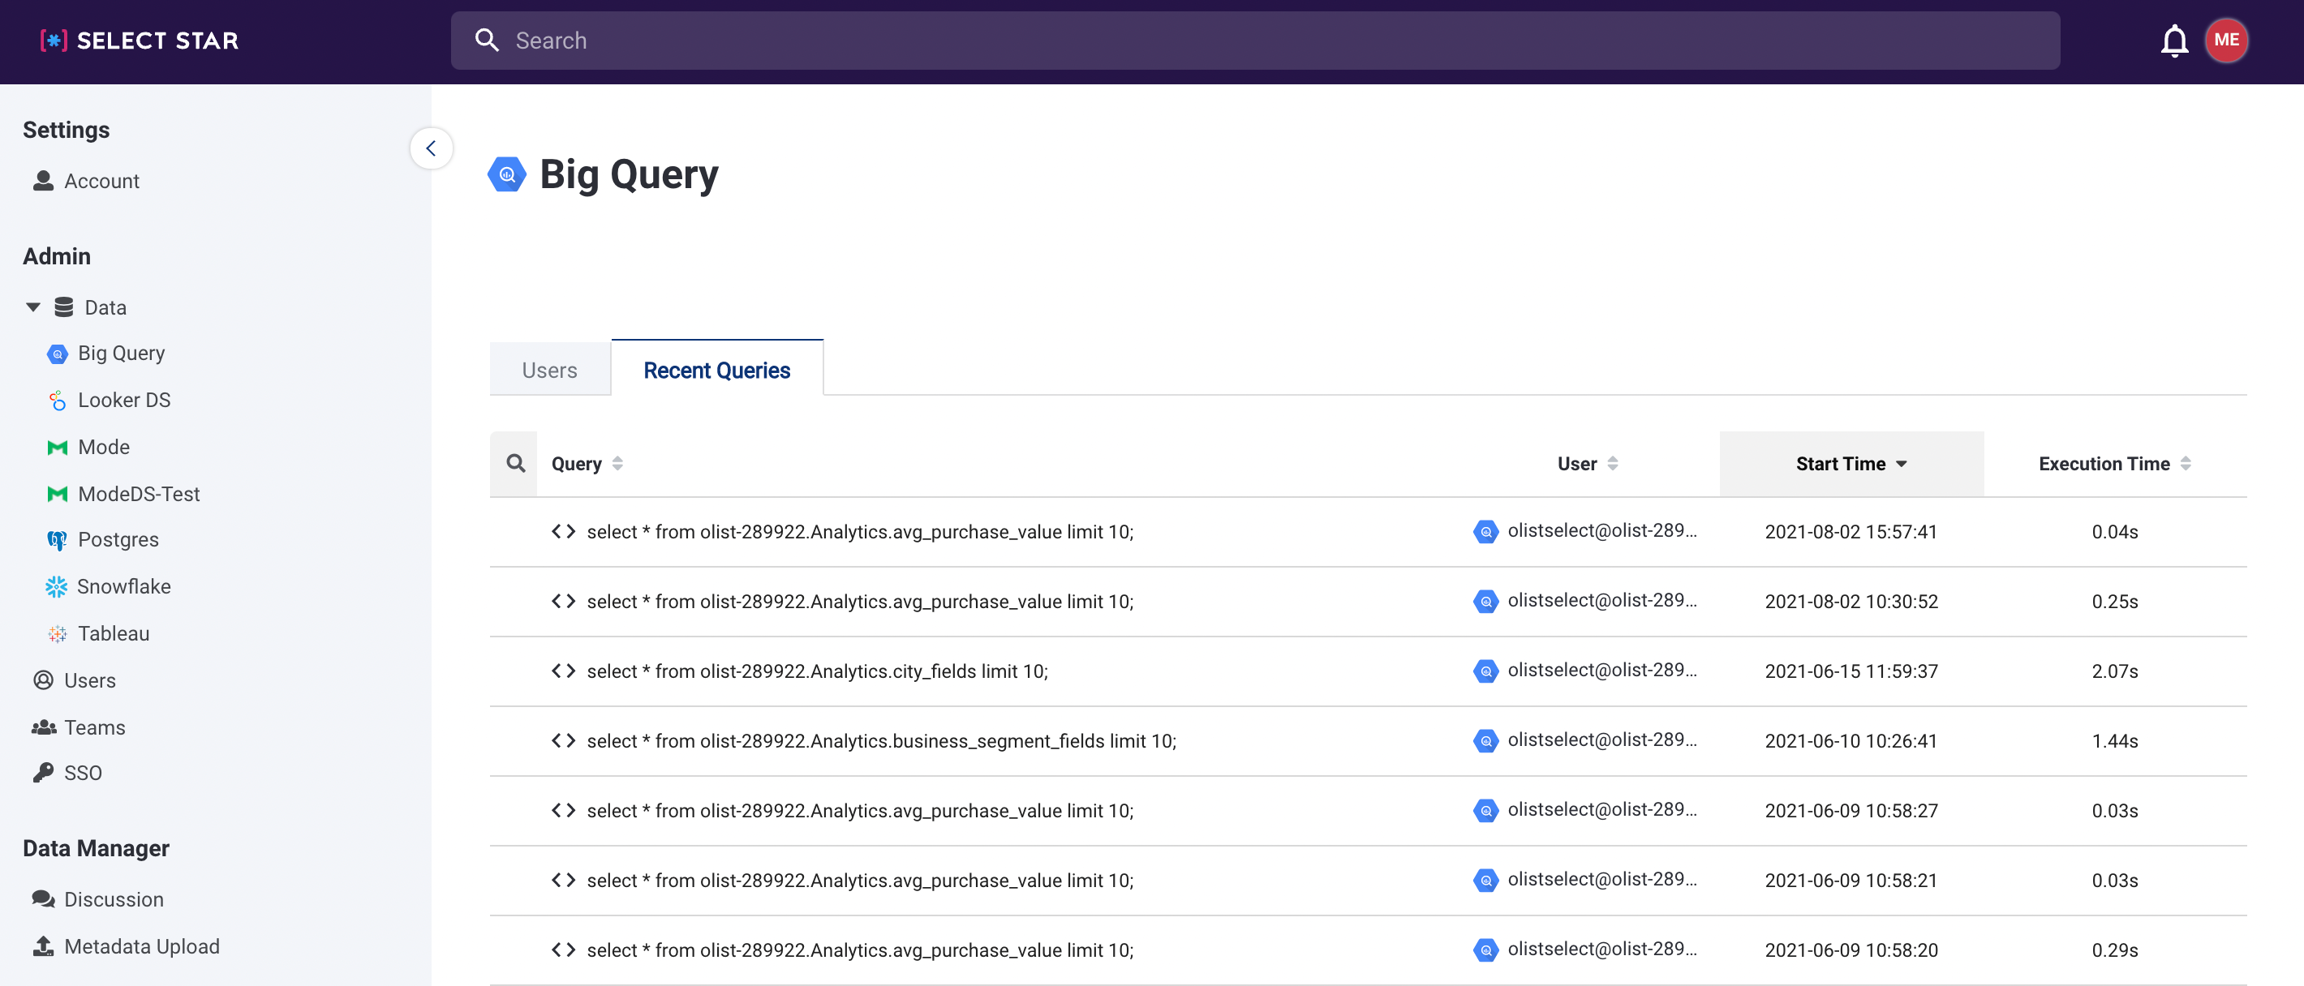
3. Recent Queries for Big Query:
Admins can now see Recent Queries from the Settings page! This shows all queries run recently on your Big Query instance from one location.
Last updated
Was this helpful?
